KEY
TAKEAWAYS
- The 2024 bank stress results show that all participating banks are able to withstand an economic collapse
- In spite of the banks passing the stress test, the XLF didn’t see much movement
- Look for XLF to reverse at its 50% Fibonacci retracement level and start gaining relative strength against the S&P 500
How well can the country’s biggest lenders hold out in an economic catastrophe? The Federal Reserve’s annual bank stress test reveals the answer.
On Wednesday (June 26, 2024), the results of the bank stress tests were released. All 31 participating banks, which included big banks, credit card companies, and regional banks, passed the test. That’s good news, especially for those who own big bank stocks; you could get a little bonus in the way of dividends. But there’s more to stress tests than dividend payouts. Let’s dive in.
What Are Bank Stress Tests?
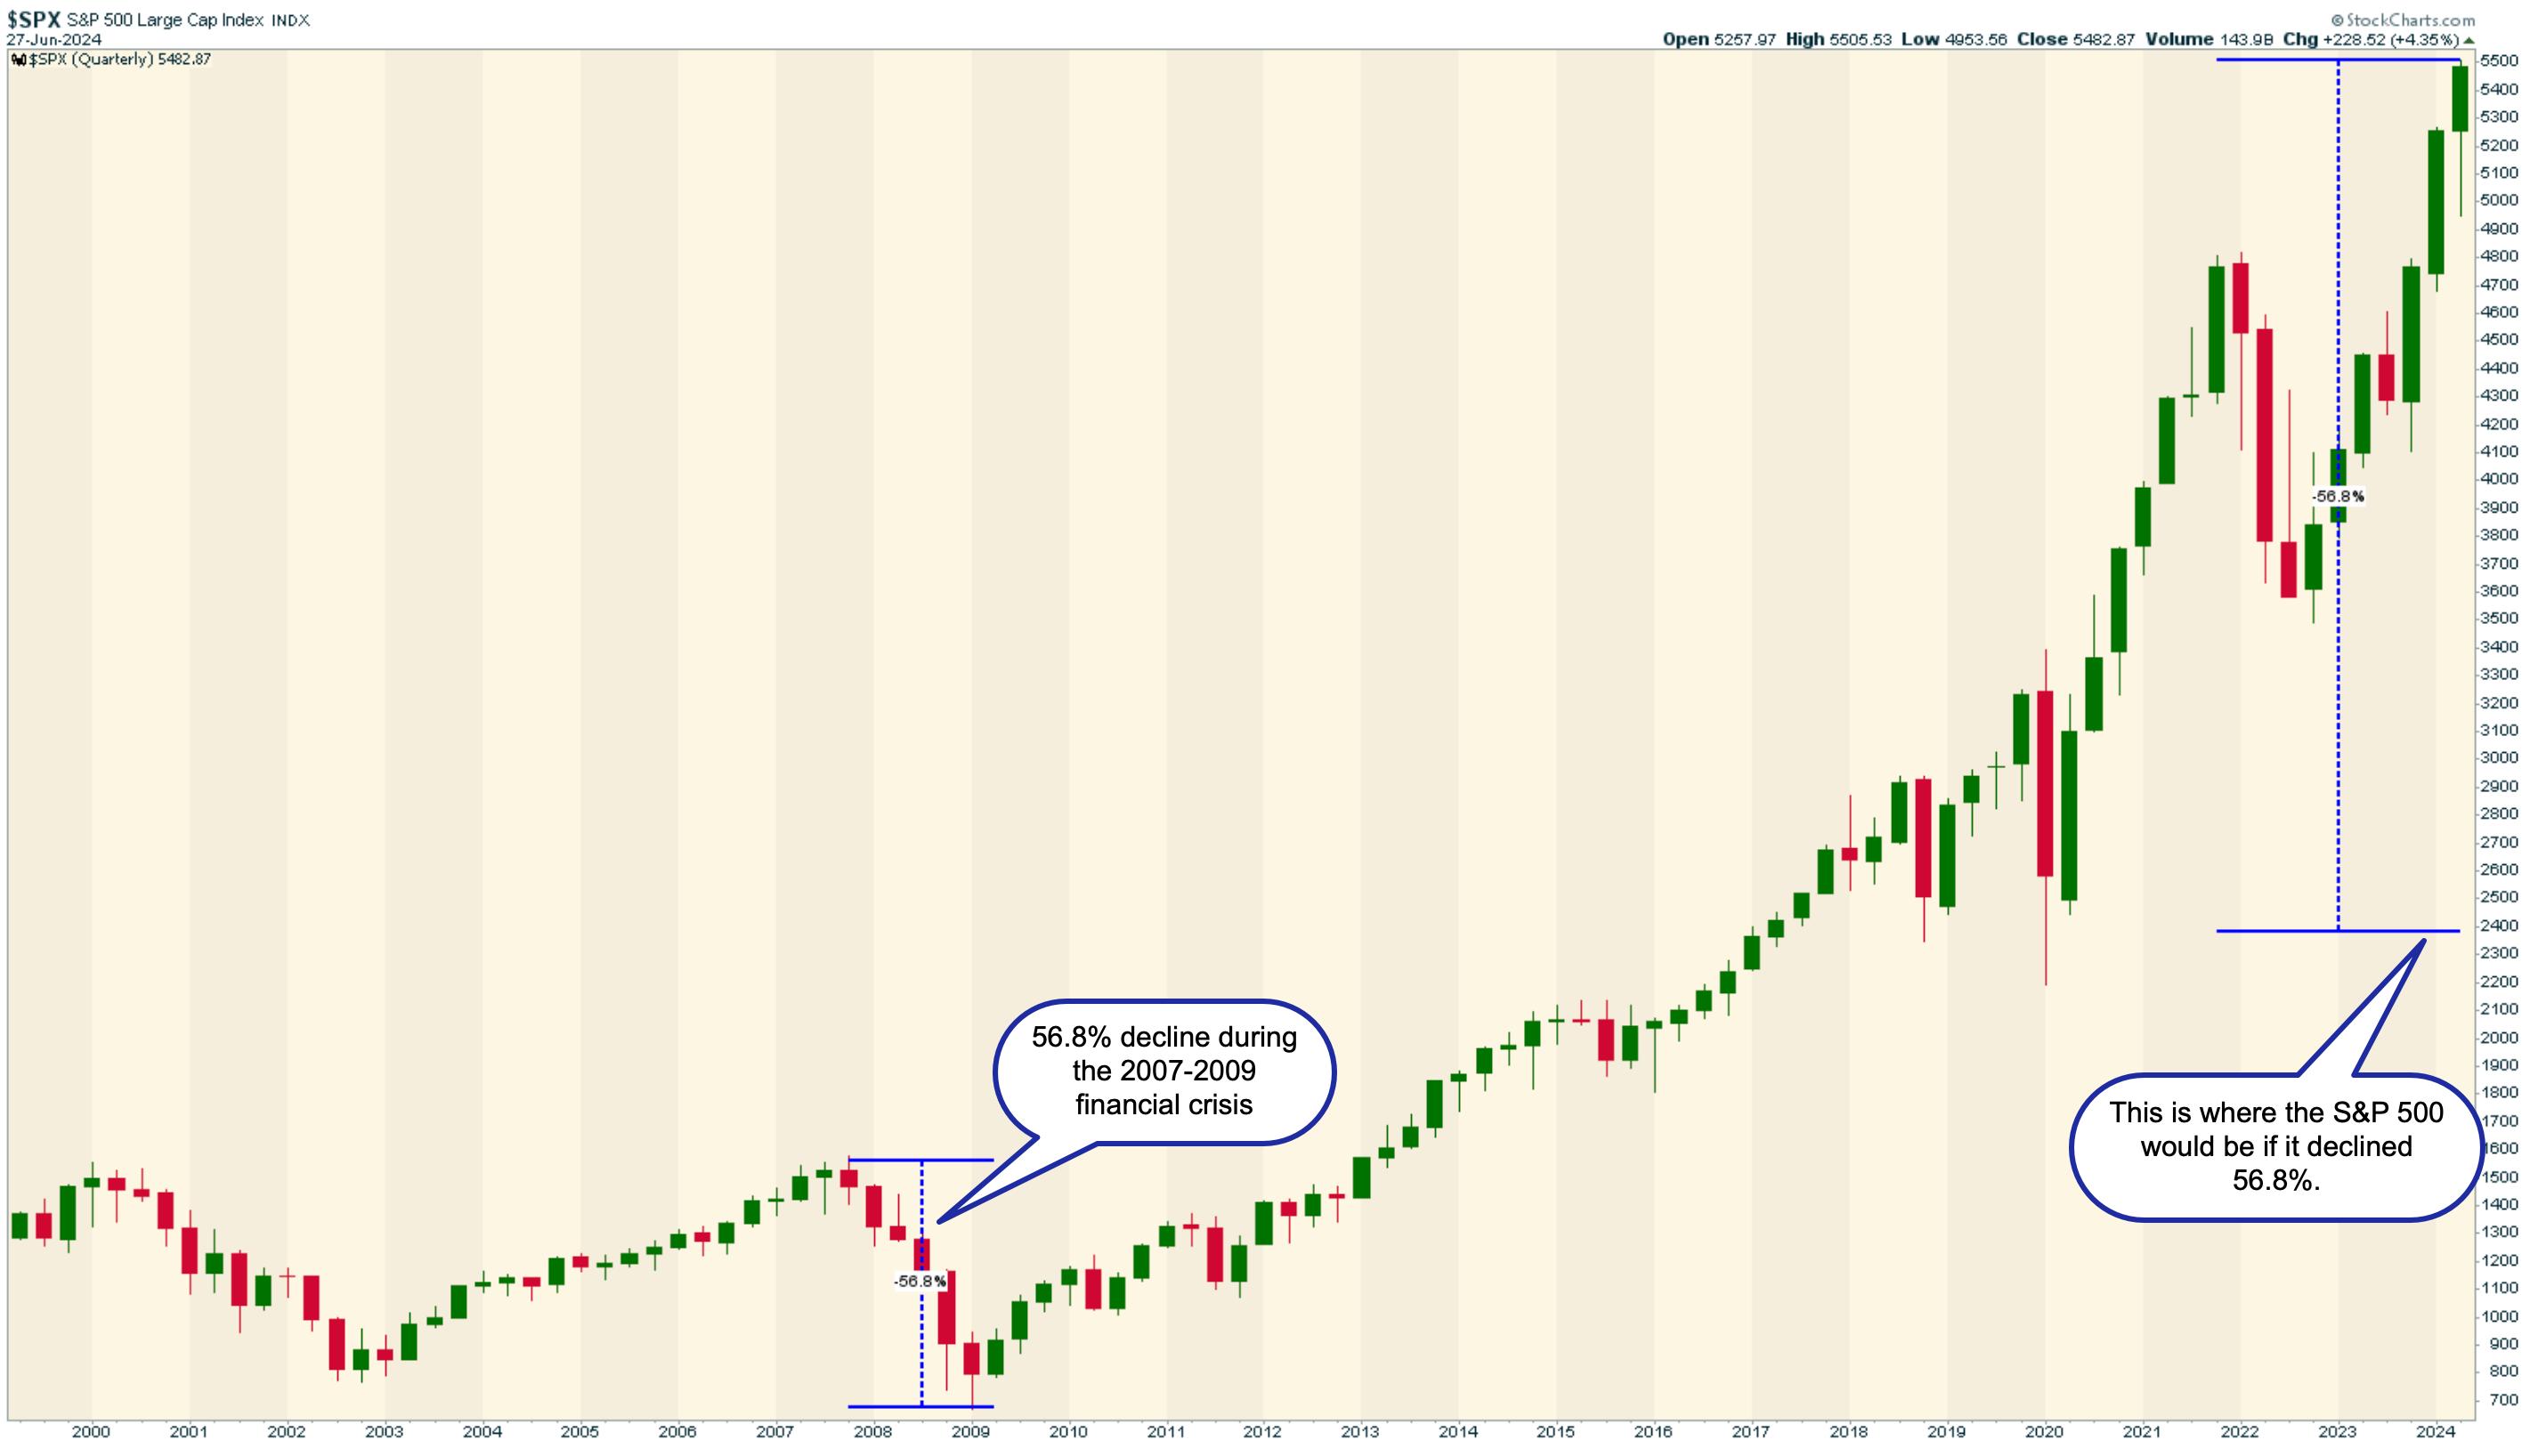
The S&P 500 ($SPX) declined 56.8% during the 2007–2009 financial crisis (see chart below). If the S&P 500 were to decline that much again, consider what that would do to your portfolio.

CHART 1. BANK STRESS TESTS WERE IMPLEMENTED TO AVOID ANOTHER FINANCIAL CRISIS. During the 2007-2009 financial crisis, the S&P 500 declined 56.8%. A similar percentage drop would bring the S&P 500 to around 2400.Chart source: StockChart.com. For educational purposes.
To prevent such a scenario from occurring, the Federal Reserve (Fed) has been conducting stress tests on the country’s biggest lenders every year since 2011. The Fed sets up a hypothetical scenario of a major economic collapse and evaluates a bank’s balance sheet against this scenario. This determines if the bank has enough assets to endure an economic collapse.
No two years are alike. Each year brings a new set of challenges. To accommodate these changes, the stress tests are modified. When the tests began in 2011, many banks failed. Over time, however, more banks have shown their capability to withstand potential economic stresses.
The test was based on a pass/fail model in the early years. That’s no longer the case. Banks must stay above a minimum capital ratio of 4.5% to pass the test. In addition, each bank has a buffer added to that 4.5%, which varies from bank to bank depending on its hypothetical loss. In 2024, a 40% decline in commercial real estate prices, a 36% decline in home prices, and a 10% unemployment rate were factored into the test.
So, if all banks pass the stress test, does it mean everything is hunky-dory? Banks have challenged the accuracy of these tests. After the 2024 test results were revealed, JPMorgan Chase (JPM) stated that, based on its estimates, losses should have been higher than what the test determined. A couple of big banks made similar statements last year.
Another point to keep in mind is that even though all banks passed the test, their capital levels dropped by about 2.8 percentage points. One reason for this is the increase in credit card loans, which all investors should keep on their radar.
Why Should Investors Pay Attention to the Stress Tests?
If the largest lenders—JPM, Wells Fargo (WFC), Citigroup (C), Bank of America (BAC), Goldman Sachs (GS), and Morgan Stanley (MS)—pass the test, their shares could trend higher, and investors could receive dividend payouts. But that doesn’t always happen.
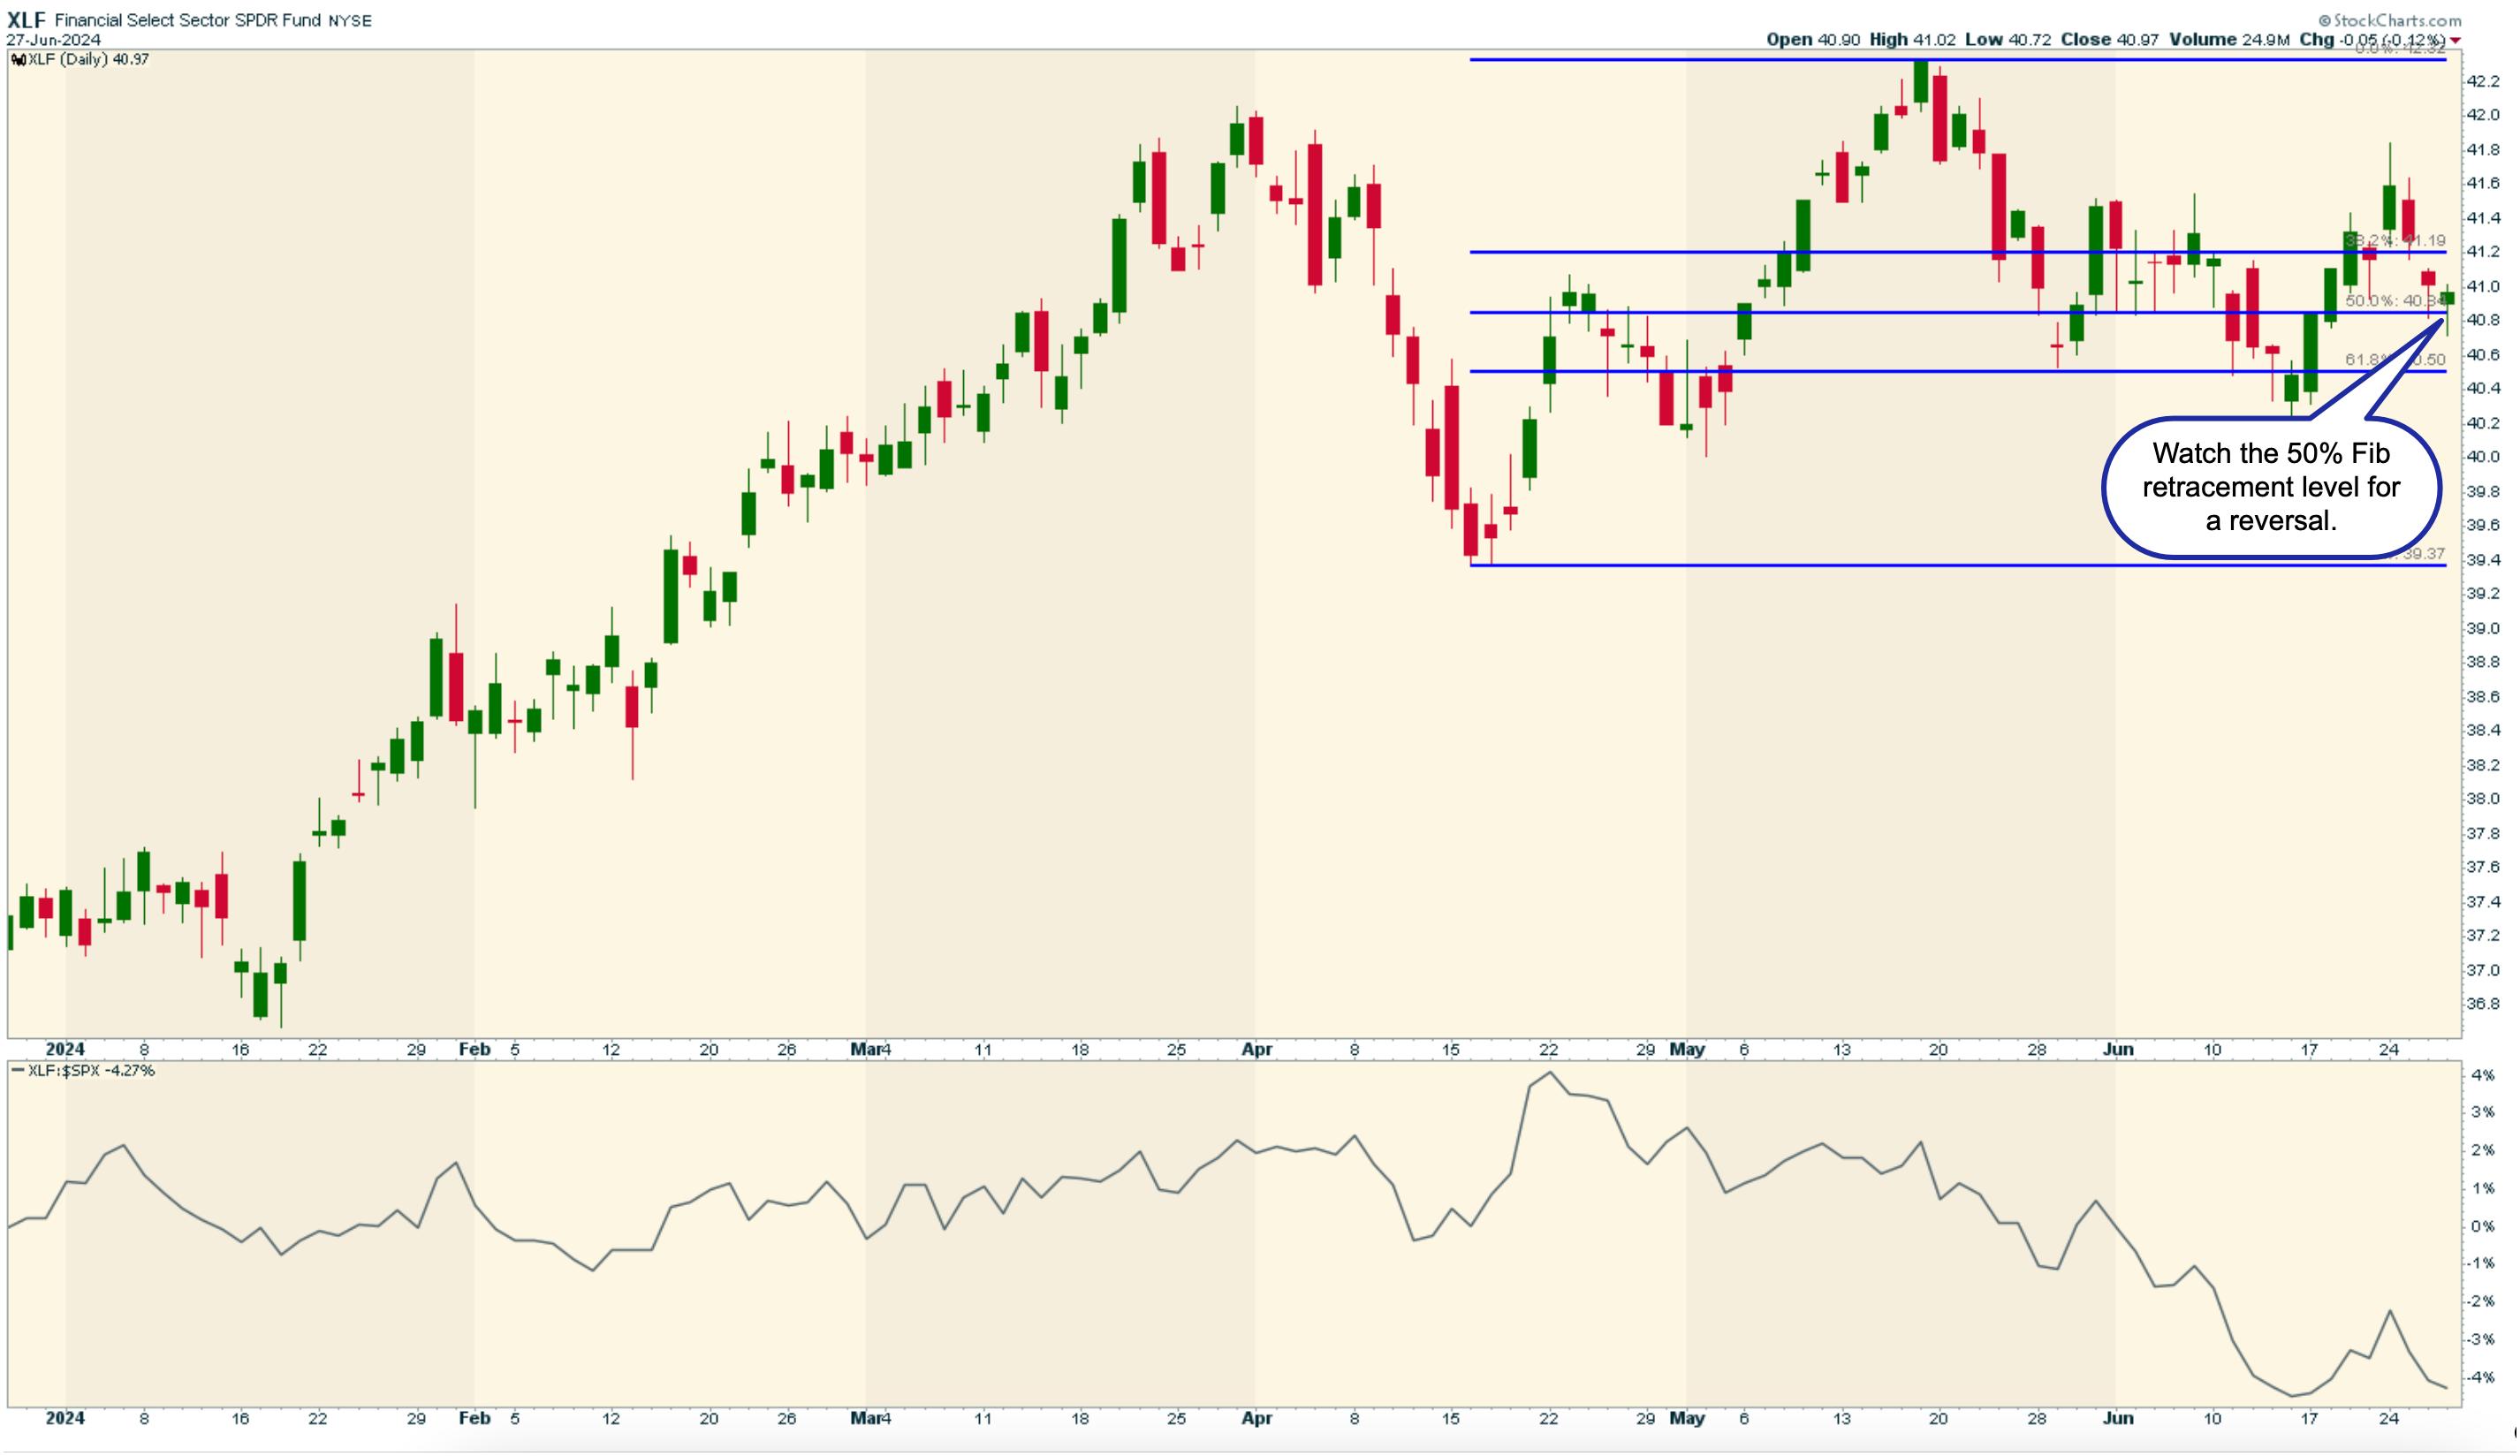
For one example, the Financial Select Sector SPDR ETF (XLF) didn’t move much the day after the test results. In the daily chart of XLF below, Fibonacci retracement levels have been applied to its most recent upward move.

CHART 2. FINANCIAL SELECT SECTOR SPDR ETF (XLF) DAILY CHART. If XLF bounces off its 50% Fibonacci retracement level and clears the 38.2% level, XLF could trend higher. It’s best to confirm the move with other indicators. For example, if XLF’s relative performance against the S&P 500 improves, it would be another checkmark to confirm an upward trend.Chart source: StockCharts.com. For educational purposes.
XLF is hovering around its 50% retracement level and is also underperforming the S&P 500. There’s not a lot there to convince anyone to go long XLF, but that could change. If XLF reversed at the 50% level, moved higher, and cleared the 38.2% level, that may be a good time to lock in some positions. If XLF’s relative performance against the S&P 500 improved, that would be further confirmation that XLF could move higher.
The Bottom Line
Nothing is guaranteed in the stock market, but bank stress tests indicate the bigger economic picture. It’s also comforting to know that big lenders will likely endure a financial shock of a large magnitude. And if you own bank shares in your portfolio, a dividend payout can be something to look forward to, although it may take a couple of months before it shows up.
Disclaimer: This blog is for educational purposes only and should not be construed as financial advice. The ideas and strategies should never be used without first assessing your own personal and financial situation, or without consulting a financial professional.

Jayanthi Gopalakrishnan is Director of Site Content at StockCharts.com. She spends her time coming up with content strategies, delivering content to educate traders and investors, and finding ways to make technical analysis fun. Jayanthi was Managing Editor at T3 Custom, a content marketing agency for financial brands. Prior to that, she was Managing Editor of Technical Analysis of Stocks & Commodities magazine for 15+ years.
Learn More


