There was no doubt that new leadership emerged last week. Here were 3 areas that surged higher, either moving to fresh 52-week highs or breaking significant downtrends:
Small Caps
The small cap Russell 2000 (IWM) has been trying to clear the 210-211 area for the past two years. After doing so late last week, the IWM appears poised to make a run at its all-time high near 235:
The really interesting part about small caps is that many traders don’t believe that they can perform well. They’ve underperformed for so long that short-term strength doesn’t feel sustainable. However, if you have long-term perspective, then you realize that recent weakness in the IWM is the outlier, not the norm. The bottom panel above shows the 10-year history of correlation between the S&P 500 and the Russell 2000. You can see that the overwhelming majority of time, the S&P 500 and the IWM move together directionally. The inverse correlation of late was the worst in the past 10 years. In fact, there’s only been one other time where inverse correlation has reached the -0.50 level and that was back in 2017. The norm is for the IWM to follow the S&P 500 higher during a secular bull market. The breakout last week is likely to see the IWM and S&P 500 correlation move back into that blue territory, particularly that dark blue territory that marks extreme positive correlation. Historically, the two spend much more time trending together.
Regional Banks:
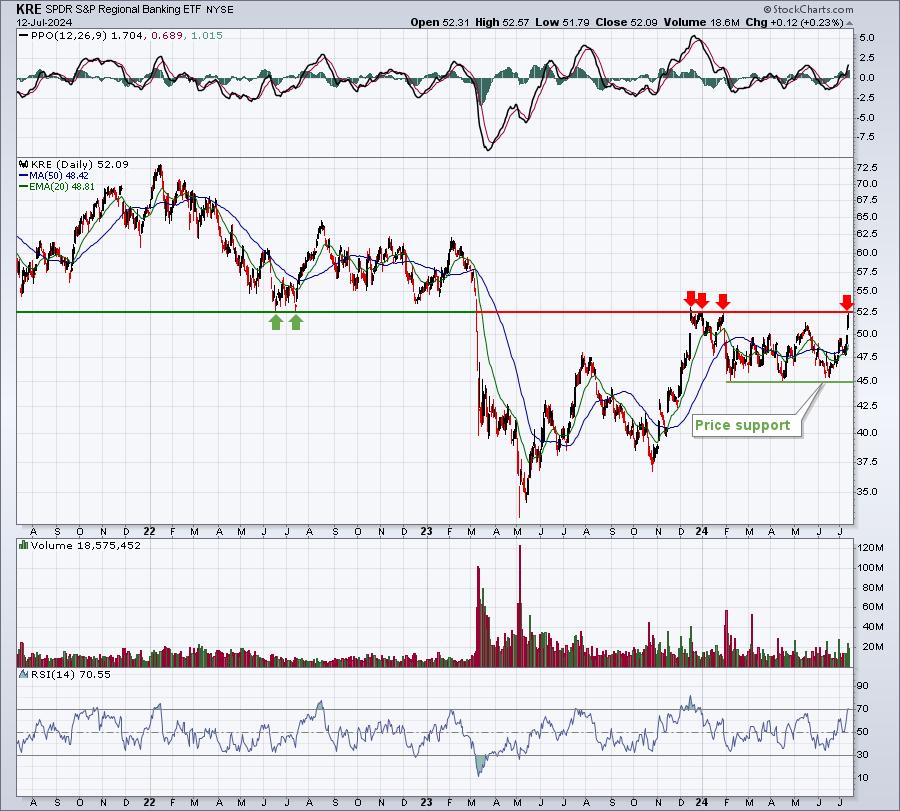
The regional banking ETF (KRE) is on the doorstep of a MAJOR breakout, so I’ll be watching this area very closely next week. It’s also one of the highest-weighted industry groups in the IWM. Over the past three years, the 52.50 level has marked key support and resistance. Check this out:

Intraday, we saw the KRE touch 52.57 on Friday, but it was unable to close above 52.50. If we see the breakout this week, we need to pay attention to regional banks that have already made breakouts and are showing leadership. I plan to feature one of my favorite regional bank stocks in our FREE EB Digest newsletter on Monday morning. If you’d like to review my chart and are not already an EB Digest subscriber, CLICK HERE to sign up. There is no credit card required and you may unsubscribe at any time.
I also look at many technically-sound financial stocks and small cap stocks on my latest “EB Weekly Market Recap” video. This week’s video, “Market Rotation in Full Effect”, is a must-see to fully understand the key rotation that we experienced last week and why that rotation could be the start of a much larger change in the attitude of traders.
Happy trading!
Tom

Tom Bowley is the Chief Market Strategist of EarningsBeats.com, a company providing a research and educational platform for both investment professionals and individual investors. Tom writes a comprehensive Daily Market Report (DMR), providing guidance to EB.com members every day that the stock market is open. Tom has contributed technical expertise here at StockCharts.com since 2006 and has a fundamental background in public accounting as well, blending a unique skill set to approach the U.S. stock market.


