KEY
TAKEAWAYS
- Traders can improve their odds with market, sector and stock filters.
- We should be in a bull market and the sector should be in an uptrend.
- The stock should be in a long-term uptrend and leading.
Even though trading based on chart analysis involves some discretionary decisions, chartists can improve the odds of success by systematizing their process. This report will show four prerequisite filters based on a top-down approach. We will start with the broader market, look at the sector, and then apply two qualifying filters to the stock.
First, I would make sure we are in a bull market. The chart below shows SPY hitting a new high in early November and trading well above its rising 200-day. This is clearly bullish for the market as a whole.
Second, I would ensure the sector is also in a long-term uptrend. TJX Cos (TJX) is part of the Consumer Staples SPDR (XLP) and this sector recorded a new high in September. It fell back into November, but remains above its rising 200-day SMA, and in a long-term uptrend. Note that TJX featured in our report and video on Friday. Click here to join and get two bonus reports.
Also notice that XLP is breaking out this week. The ETF formed a falling wedge and retraced 50-62.18% of the July-September advance. Both the pattern and the retracement are normal for corrections within bigger uptrends. XLP is breaking out of the wedge to signal a continuation of the bigger uptrend.
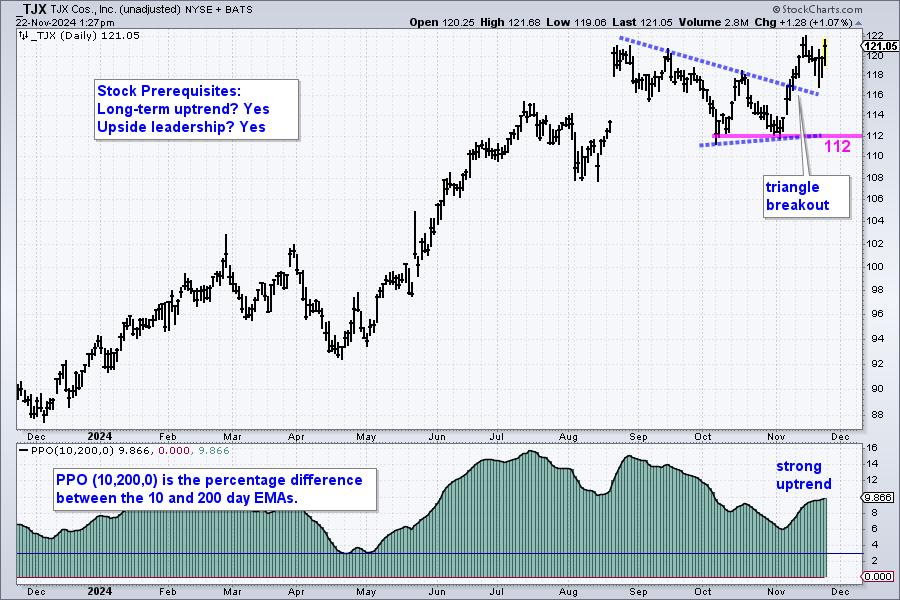
Turning to the stock filters, I want the stock to be in a long-term uptrend and to show upside leadership. On the TJX chart below, prices are moving from the lower left to the upper right, and the stock recorded a new high this month. Stocks hitting new highs are in strong uptrends and show upside leadership. Also notice that the 10-day EMA is 9.8% above the 200-day EMA. The bottom indicator shows the PPO (10,200,0), capturing the percentage difference between these two EMAs.

TJX meets all the prerequisites and also sports a bullish breakout on the price chart. After surging to a new high in mid August, the stock consolidated with a triangle. A consolidation within an uptrend is a bullish continuation pattern. TJX broke out with a strong move in November and this signals a continuation of the uptrend. Re-evaluation support is set at 112.
Highlights from Recent Reports/Videos:
- S&P SmallCap 600 SPDR surges after throwback to breakout zone.
- A Short-term setup could lead to a long-term breakout for DataDog (DDOG).
- Medical Devices stand out in an underperforming healthcare sector.
- Robotics & AI ETF triggers big breakout and holds above breakout zone.
- Gold and Uranium break out as Lithium sets up.
Click here to join and get two bonus reports!
//////////////////////////////////
Choose a Strategy, Develop a Plan and Follow a Process
Arthur Hill, CMT
Chief Technical Strategist, TrendInvestorPro.com
Author, Define the Trend and Trade the Trend
Want to stay up to date with Arthur’s latest market insights?
– Follow @ArthurHill on Twitter

Arthur Hill, CMT, is the Chief Technical Strategist at TrendInvestorPro.com. Focusing predominantly on US equities and ETFs, his systematic approach of identifying trend, finding signals within the trend, and setting key price levels has made him an esteemed market technician. Arthur has written articles for numerous financial publications including Barrons and Stocks & Commodities Magazine. In addition to his Chartered Market Technician (CMT) designation, he holds an MBA from the Cass Business School at City University in London.


