
“When do I sell?” is easily the most-asked question I’ve received over the years. There are multiple answers to this question based on certain variables. The first key variable is whether you’re a day trader, short-term swing trader, or long-term buy and holder. I prefer swing trading, so my answer many times is when corroborating technical evidence tells me to sell.
My easiest sell is after a failed attempt at a breakout or a major reversing candle on heavy volume. The first one is fairly easy to see. Let’s use Palantir Technologies, Inc. (PLTR) as an example from Friday. I don’t know if PLTR is going up on Monday or later this week, but what I do know is it broke out to an intraday all-time high on Friday, then failed to hold that breakout on a closing basis. Check this out:
First, let me say that PLTR has a very strong chart. The AD line is continuously rising, a bullish cup has formed, and PLTR is a leader amongst software stocks ($DJUSSW). Second, I’m not saying PLTR is a short candidate. I’m simply saying it would be a sell for me short-term to take profits. I rarely short during secular bull markets. If it does make the breakout, I can always decide to jump back in. But I’d be looking for PLTR to pull back to form a handle off the cup pattern, or possibly even pull back to the recent low near 65. Sideways consolidation is a very real possibility after an extended advance like the one PLTR has enjoyed. If you need further evidence, look no further than NVIDIA Corp (NVDA) after its June/November/January tops. It’s still consolidating.
The two red arrows mark what “could” be a double top, resulting in a lengthy period of selling and/or consolidation. Taking profits now is a risk-management strategy, eliminating the possibility of riding PLTR back to the downside. If income taxes is a concern and you’re a long-term investor, I see nothing to suggest PLTR is a sell here. I’m only discussing my preferred short-term swing trading strategy.
A second stock with a similar look would be Parker Hannifin Corp (PH), which surged on Thursday after its earnings report. PH then tacked on further gains on Friday and found itself intraday in all-time-high territory. It too looks like a cup has formed:
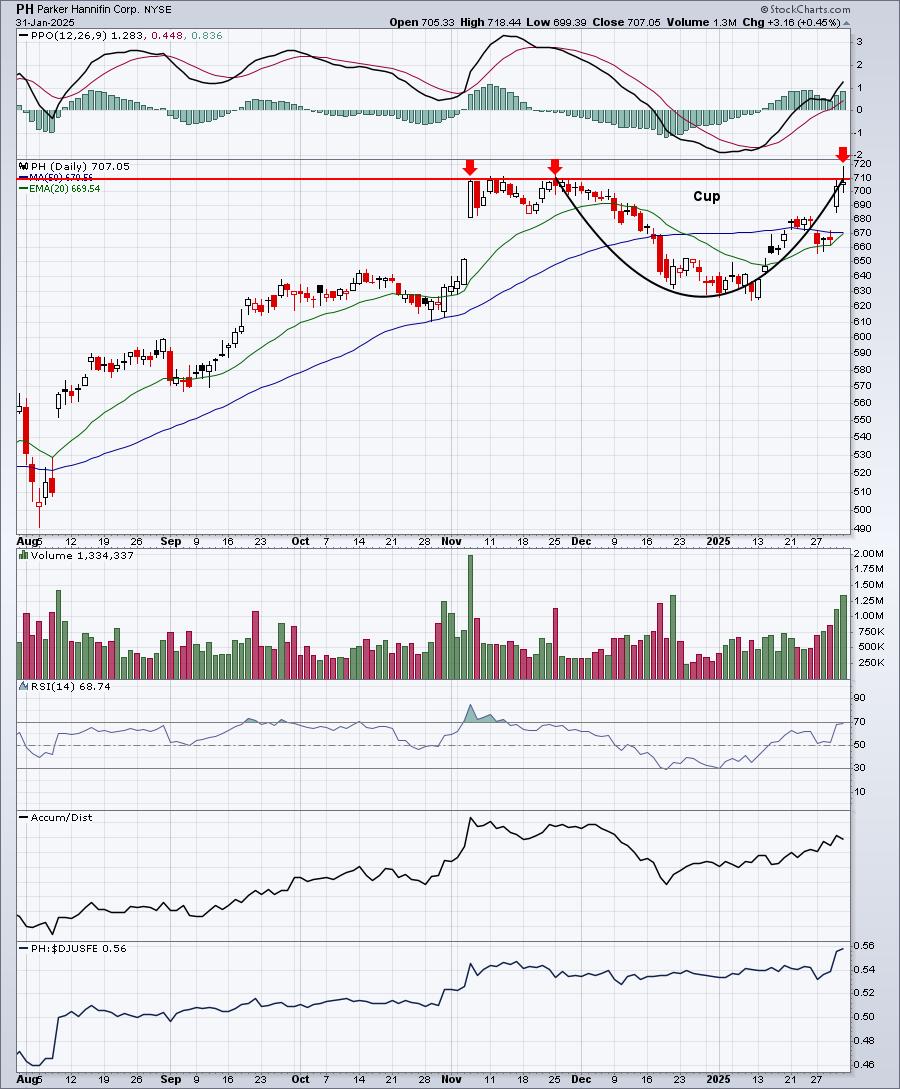
The AD line here doesn’t seem quite as strong as PLTR, but PH clearly is a leader in the industrial machinery space ($DJUSFE). As I looked around the market on Friday, and really throughout the week, I couldn’t help but see a TON of companies testing key overhead price resistance.
The S&P 500 filled its gap from the severe drop on Monday morning, then printed a bearish engulfing candle on Friday:

Seeing the S&P 500 fail at all-time highs and gap resistance, with well-above-average volume makes me very nervous, especially given the overall market environment.
You’re Invited!
There are a number of bearish signals emerging that I want to discuss with our entire EarningsBeats.com community. Accordingly, we’ll be hosting a FREE webinar on Monday, February 3rd at 5:30pm ET. There’s no credit card required, but you do need to register with your name and email address. CLICK HERE for more information.
Happy trading!
Tom

Tom Bowley is the Chief Market Strategist of EarningsBeats.com, a company providing a research and educational platform for both investment professionals and individual investors. Tom writes a comprehensive Daily Market Report (DMR), providing guidance to EB.com members every day that the stock market is open. Tom has contributed technical expertise here at StockCharts.com since 2006 and has a fundamental background in public accounting as well, blending a unique skill set to approach the U.S. stock market.


 Silver Cross BUY Signal May Arrive Too Late")