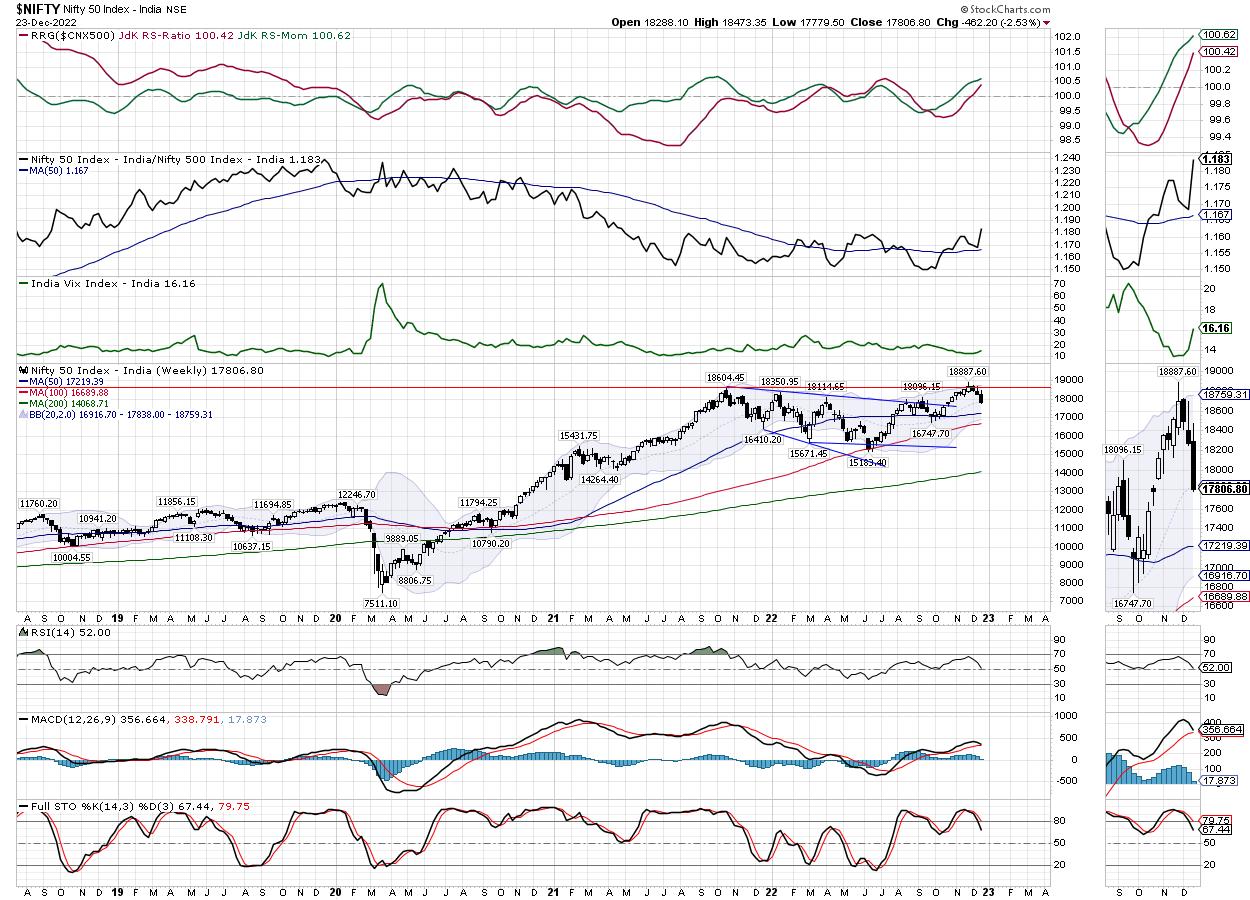
Over the past few days, the 18600 levels at NIFTY have become of great importance as the index made a breakout above this point, but finally slipped below this level after a complete pullback. It has been mentioned quite often in previous editions of the weekly technical notes that any failure to stay above 18600 will not only mean a failed breakout for the markets but could also propel NIFTY into a prolonged corrective consolidation. The week before, NIFTY had slipped below this point; In the previous week, the index extended its downward movement. While seeing a broader trading range of 693 points, the index staged a corrective decline and ended with a weekly net loss of 462.20 points (-2.53%).
The last two weeks have been technically damaging; NIFTY slipping below the 18600 level has pulled down resistance levels for the index. Now the 18400-18600 zone represents a very strong resistance zone for the markets going from here. For an upward movement to resume, this zone must be breached. Until this happens, NIFTY will continue to display a corrective undertone. The index has closed a notch below the shorter 20-week ma, which currently stands at 17838. If this isn’t defended on a weekly close basis, it can add some additional weakness. If this point is defended, it may keep the markets in an ongoing consolidation.
Volatility surged as INDIAVIX surged 14.85% weekly to 16.16. Global markets have recovered somewhat from the downturn; this could help our markets start the week relatively stable. In the coming week, the 17930 and 18220 levels are likely to act as potential resistance points. The supports are at 17710 and 17580.
The weekly RSI is 52; it is neutral and shows no deviation from the price. The weekly MACD is bullish and staying above the signal line. However, the narrowing slope of the histogram shows that this indicator could have a negative crossover in the coming days.
Pattern analysis of the chart shows that the NIFTY attempted a breakout by moving above the previous high of 18604; however, after testing the 18,887 levels, the index not only retested the 18,600 breakout point, but slipped well below that level. So far the breakout attempt has failed and NIFTY continues to face strong resistance at 18600.
The holiday season should keep total volumes at lower levels; this should keep the overall markets within a defined range. There are strong opportunities for a technical pullback given the type of unidirectional pullback we have seen. Apart from that, the action will remain strongly stock-specific in nature. We may see defensive pockets doing well, but renewed Covid fears could keep markets a little tentative in the coming days. Keeping leveraged positions at modest levels and vigilantly protecting profits on either side of the move is highly recommended. A cautious outlook is recommended for the week.
Industry analysis for the coming week
In our look at Relative Rotation Graphs®, we compared various sectors to the CNX500 (NIFTY 500 Index), which represents over 95% of the free float market capitalization of all listed stocks

Analysis of the Relative Rotation Graphs (RRG) shows that the PSE Sector Index has rolled into the leading quadrant. This index, along with the Metal, Nifty Bank, PSU Bank, Infrastructure, Commodities, and Financial Services indices that are in the leading quadrant, should relatively outperform the broader NIFTY500 index.
The FMCG index remains in the weaker quadrant.
The Midcap 100 index has rolled into the lagging quadrant. In addition to this index, the Nifty Consumption, Auto, Realty and Media indices also languish in the lagging quadrant.
The energy index has rolled into the improving quadrant and could show stock specific outperformance along with the IT index which is also within the improving quadrant. The NIFTY Pharma Index is also in the improving quadrant but appears to be giving up its relative momentum significantly.
Important NOTE: RRG™ charts show relative strength and momentum for a group of stocks. In the chart above they show relative performance against the NIFTY500 Index (broader markets) and should not be used directly as buy or sell signals.
Milan Vaishnav, CMT, MSTA
Consulting Technical Analyst

Milan Vaishnav, CMT, MSTA is a capital markets professional with nearly two decades of experience. His area of expertise includes consulting in portfolio/fund management and advisory services. Milan is the founder of ChartWizard FZE (UAE) and Gemstone Equity Research & Advisory Services. As a Consulting Technical Research Analyst and with over 15 years experience in the Indian capital markets, he has provided clients with top quality independent technical research focused on India. He is currently a daily contributor to ET Markets and The Economic Times of India. He is also the author of one of India’s most accurate Daily/Weekly Market Outlooks – a Daily/Weekly Newsletter currently in its 18th year of publication.


