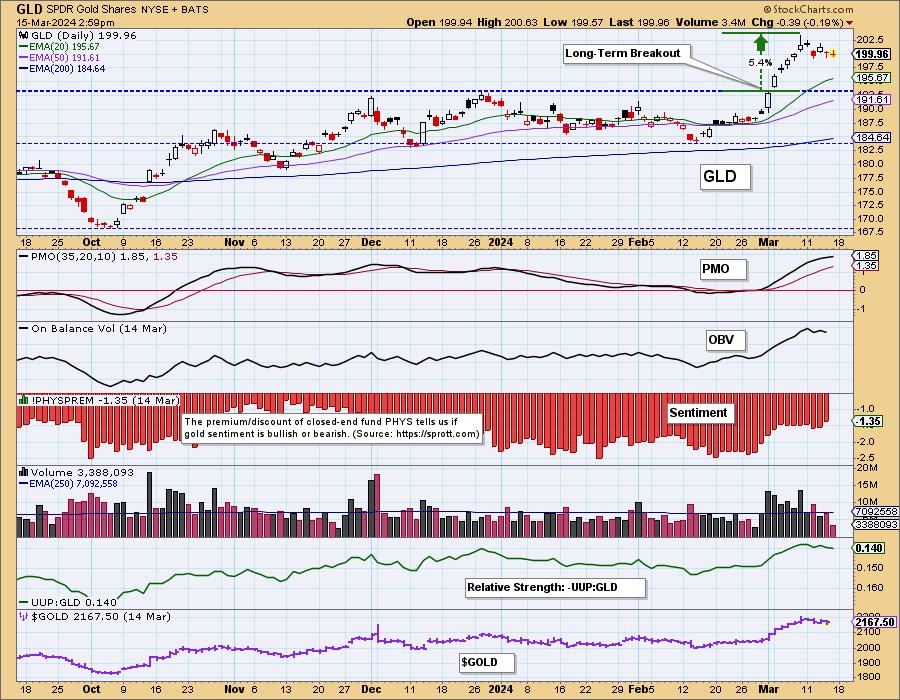
This month, the SPDR Gold Shares (GLD) broke out to new, all-time highs. That was a significant long-term move, which we will discuss when we get to the monthly chart.
Of more immediate interest is the fact that sentiment is still bearish, which bodes well for a continued advance. We gauge sentiment based upon whether closed-end fund Sprott Physical Gold Trust (PHYS) is selling at a premium (bullish sentiment) or discount (bearish sentiment). Currently, PHYS is selling at a discount to NAV.

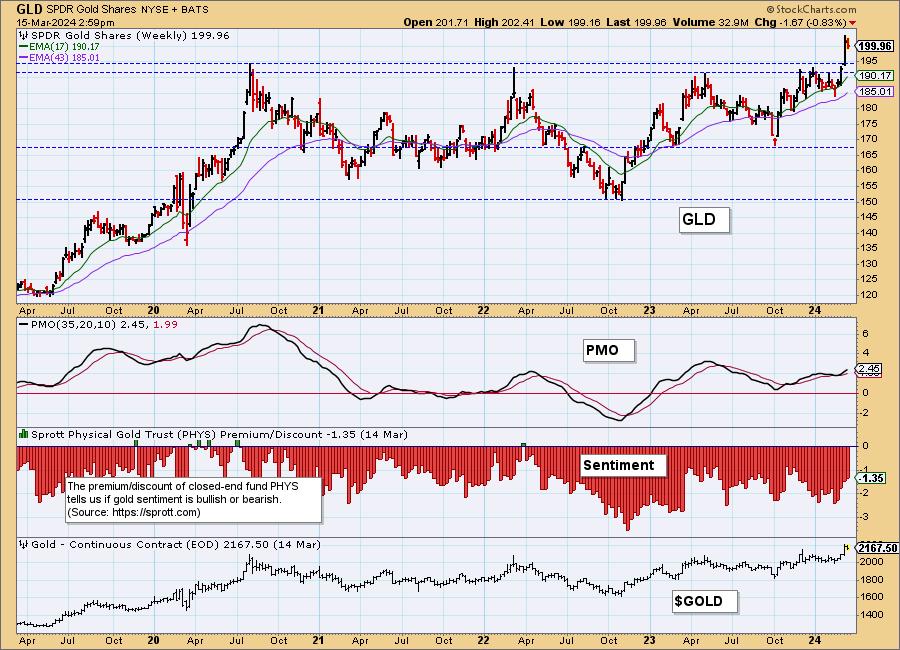
The weekly chart gives a better perspective of the significance of the breakout, which was decisive. The overhead resistance has held GLD back for more than three years, and has now become support.

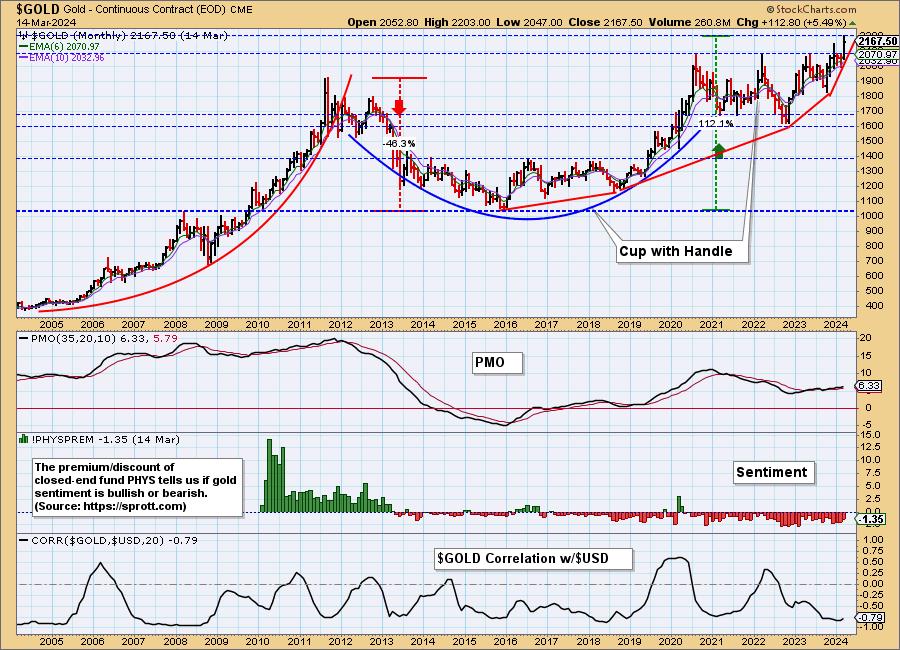
But the monthly chart shows that it has been a much longer wait than three years. Gold made all-time highs back in 2011, following which it declined nearly fifty percent. It finally recovered to new, all-time highs in 2020, but it has been stalled until this month. Practically speaking, gold investors have been waiting about 13 years for this encouraging move. The positive side is that gold has established a solid high-level base at around 2,000 to provide future support. Also note how bullish sentiment got (a premium of about +14%) during the parabolic advance on the left side of the chart.

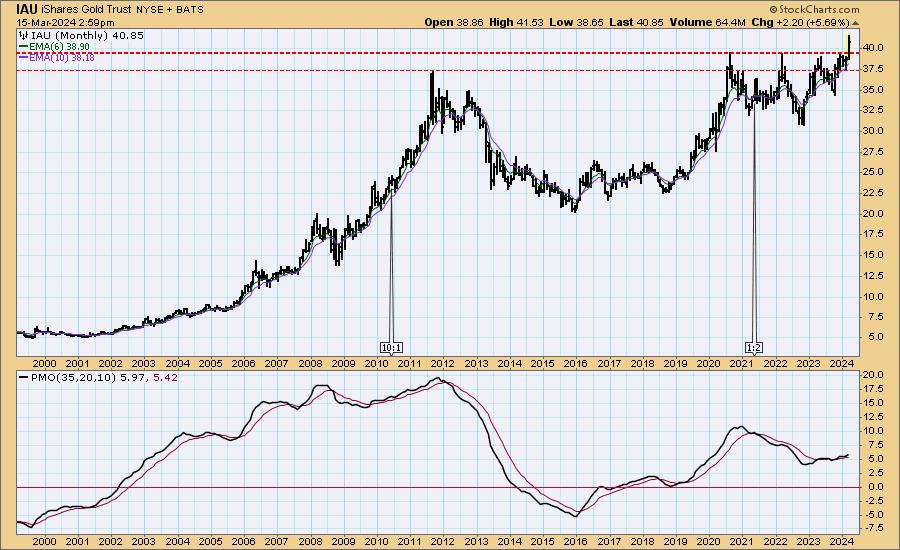
Investing in gold presents some difficulties that must be considered. (Disclaimer: This is information, not a recommendation.) If you buy physical gold, you have to have a safe place to store it. A safe deposit box can be accessed/frozen by the government, and an adequate safe is expensive, difficult to move, and entails some vulnerability. Some ETFs, like GLD, do not actually own physical gold. An alternative is iShares Gold Trust (IAU), which is a closed-end fund that owns physical gold. Sprott Physical Gold Trust (PHYS) is similar to IAU, but it is a foreign entity based in Canada. Consider the implications of all options available.

Conclusion: Gold’s recent breakout was a long time coming and appears to have positive long-term implications. Also, the long period of consolidation has created an impressive base of long-term support.
Learn more about DecisionPoint.com:
Watch the latest episode of the DecisionPointTrading Room on DP’s YouTube channel here!
Try us out for two weeks with a trial subscription!
Use coupon code: DPTRIAL2 at checkout!
Technical Analysis is a windsock, not a crystal ball. — Carl Swenlin
(c) Copyright 2024 DecisionPoint.com
Disclaimer: This blog is for educational purposes only and should not be construed as financial advice. The ideas and strategies should never be used without first assessing your own personal and financial situation, or without consulting a financial professional. Any opinions expressed herein are solely those of the author, and do not in any way represent the views or opinions of any other person or entity.
DecisionPoint is not a registered investment advisor. Investment and trading decisions are solely your responsibility. DecisionPoint newsletters, blogs or website materials should NOT be interpreted as a recommendation or solicitation to buy or sell any security or to take any specific action.
Helpful DecisionPoint Links:
Price Momentum Oscillator (PMO)
Swenlin Trading Oscillators (STO-B and STO-V)

Carl Swenlin is a veteran technical analyst who has been actively engaged in market analysis since 1981. A pioneer in the creation of online technical resources, he was president and founder of DecisionPoint.com, one of the premier market timing and technical analysis websites on the web. DecisionPoint specializes in stock market indicators and charting. Since DecisionPoint merged with StockCharts.com in 2013, Carl has served a consulting technical analyst and blog contributor.
Learn More


