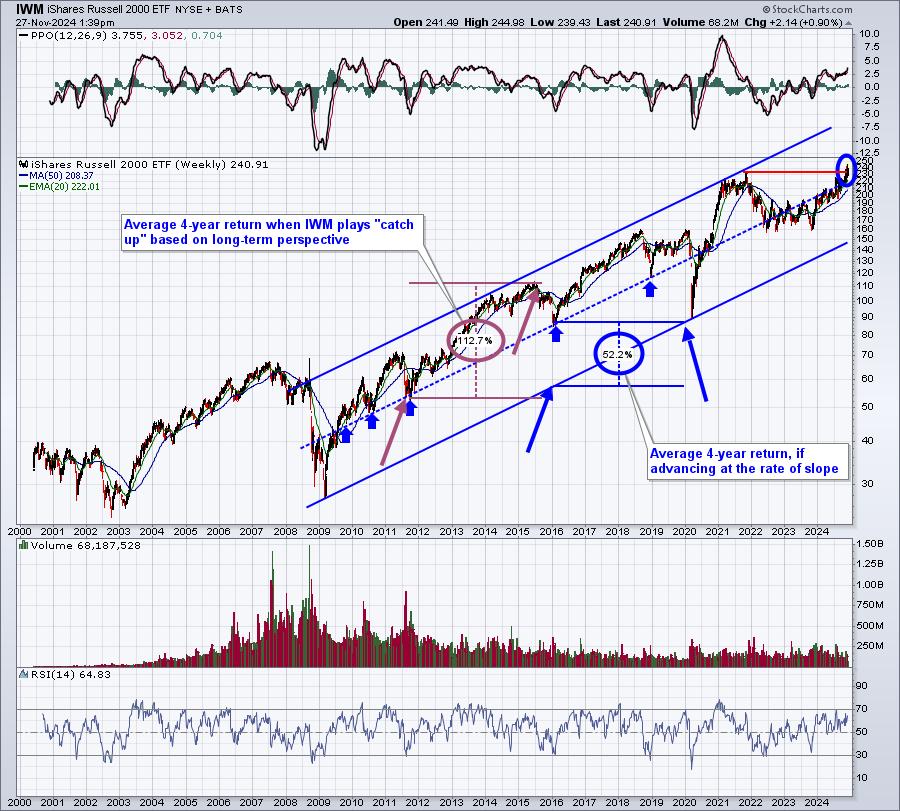
If you want big returns, I’m convinced you’ll find them in small caps. When I make bold predictions, and many of you know that I do fairly often, it’s usually supported by long-term perspective. Most everyone has a negative bias towards small caps right now, because they’ve underperformed so badly the past few years. But I use perspective on small caps just as I did in 2022 on the large caps. Let me use the S&P 500 as an example:
Do you remember how bullish sentiment was at the end of 2021? We had the most complacent readings EVER on the 253-day SMA of the equity only put call ratio. And we had an “overshoot” on the S&P 500 outside of the secular bull market channel. That left the likelihood of little upside and the potential of plenty of downside to test the “middle” channel level where most corrections and/or cyclical bear markets end. At MarketVision 2022 in January 2022, I discussed the very real possibility of a 20-25% cyclical bear market decline to last 3-6 months and this was a chart that supported my theory. There were other reasons as well, but I’m focused in this article on perspective and the benefits of having long-term perspective and not being overcome by short-term recency bias. We actually saw the cyclical bear market drop 28% and last 9 1/2 months. It wasn’t a perfect call, but it was pretty darn solid.
Notice that those tests of the blue-dotted “middle” upslope line are excellent opportunities to jump in for what’s likely to follow – a strong uptrend to return back to the upper channel line.
So how does the small cap IWM look right now:

The blue “percentage change” shows 52%, but this is measuring a 4-year period where price action simply follows the bottom of the slope. However, the maroon “percentage change” shows what happens if you increase at a much, more rapid pace from the blue-dotted “middle” upslope line to the upper solid blue upslope line, in this case rising 112% – more than twice the rate if you simply go along for the ride with the slope. I believe the IWM has just begun a very significant rise back towards its upper channel line. I won’t be surprised if the IWM hits 400 in 2025, which would represent nearly a 70% return. This type of a move would be no different that what we’ve seen in the past on both of the above charts.
Again, to make these types of predictions, you have to be willing to ignore what’s happened recently (check your recency biases at the door), and focus on what the long-term channel is telling you. Could I be wrong? Absolutely. But I firmly believe small caps will continue the leadership role we’ve seen of late, significantly outperforming the S&P 500 and NASDAQ 100.
I’m writing a special EB Digest on Friday and highlighting a small stock that I believe could TRIPLE over the next year. Our EB Digest is our FREE newsletter that requires no credit card. You may unsubscribe at any time. To claim this small cap stock on Friday, simply CLICK HERE to sign up for our FREE EB Digest newsletter.
Happy Thanksgiving everyone and happy trading!
Tom

Tom Bowley is the Chief Market Strategist of EarningsBeats.com, a company providing a research and educational platform for both investment professionals and individual investors. Tom writes a comprehensive Daily Market Report (DMR), providing guidance to EB.com members every day that the stock market is open. Tom has contributed technical expertise here at StockCharts.com since 2006 and has a fundamental background in public accounting as well, blending a unique skill set to approach the U.S. stock market.


