The December Consumer Price Index (CPI) was welcome news for the stock market. Headline and core CPI numbers were in line with expectations. Headline CPI is up 6.5% year over year and core CPI is up 5.7%. While the slowing inflation figure was probably already priced into the market, the broader market indices all closed higher. It’s a step in the right direction and if this trend continues, it will be good news for the stock market going forward. But it’s not a closed deal.
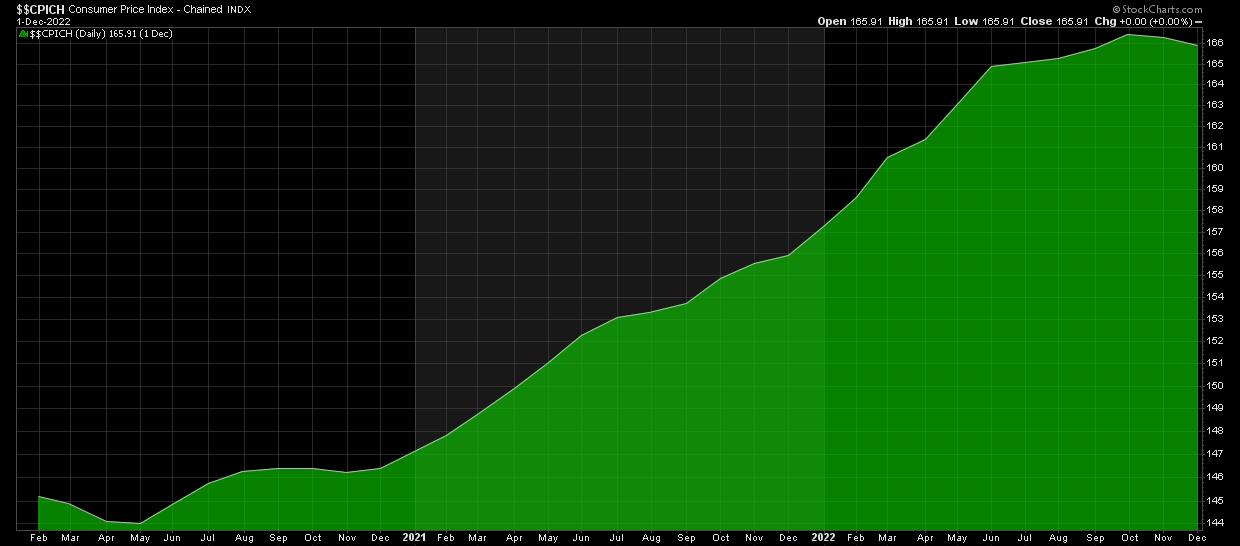
There needs to be a slowdown in rents and services, two areas that are still putting pressure on inflation. The labor market and wage growth will need to cool much more before inflation can get close to the 2% target. If you look at a chart of Headline CPI ($$CPICH), you’ll see that it starts trending down (see Chart 1). And that’s a sure sign that inflation is indeed cooling.
 CHART 1: CHAINED CONSUMER PRICE INDEX ($$CPICH). The uptrend in headline CPI is starting to slow down. Chart source: StockCharts.com. For illustration only.
Are investors becoming more complacent?
Another area to watch is volatility. The CBOE Volatility Index ($VIX) appears to be finding a new home below the 20 level. If it stays at these levels or even falls below pre-pandemic levels, it could be a sign that investors are becoming more complacent. But that would mean investors would be skewed towards risk-on assets, but gold is trading higher. Does this mean that investors are still uncertain and want to proceed cautiously? Perhaps, considering the earnings season kicks off with four big banks – JP Morgan Chase (JPM), Wells Fargo Bank (WFC), Citigroup (C) and Bank of America (BAC).

Banks are preparing for the earnings season as their results provide a comprehensive picture of the state of the economy. That’s enough to make investors a little nervous.
Credit is a major driver of bank earnings. If you want a mortgage or car loan, you have to go to your bank to get one. Higher interest rates help banks make higher profits on loans. It will be interesting to see how much the higher rates have helped. You will also get an insight into the trading activity that took place during the last quarter; Given the market’s volatility over the last quarter, there’s a chance that trading activity has increased. Another important topic to watch out for in bank reports is business conditions and consumer credit. It’s a great indicator for gaining insight into business and consumer activity, two major economic drivers.
Recession or Soft Landing?
The Fed will make its next rate decision on February 1st. Hopefully Jay Powell and his team are positive about the December CPI number. But it’s just a data point. Another rate hike is likely, at least for the next few sessions, but the pace at which rates are being raised may be slowing. the CME FedWatch tool shows a probability of over 90% that the Fed will hike rates by 25 basis points. That would be an indication that inflation is cooling, which could mean a soft landing. If the Fed decides to hike rates by 50 basis points, the market could volatize wildly. Much depends on the labor market and services. If both start to cool, it could be an indication that the Fed is on the home stretch of raising rates.
The stock market is optimistic
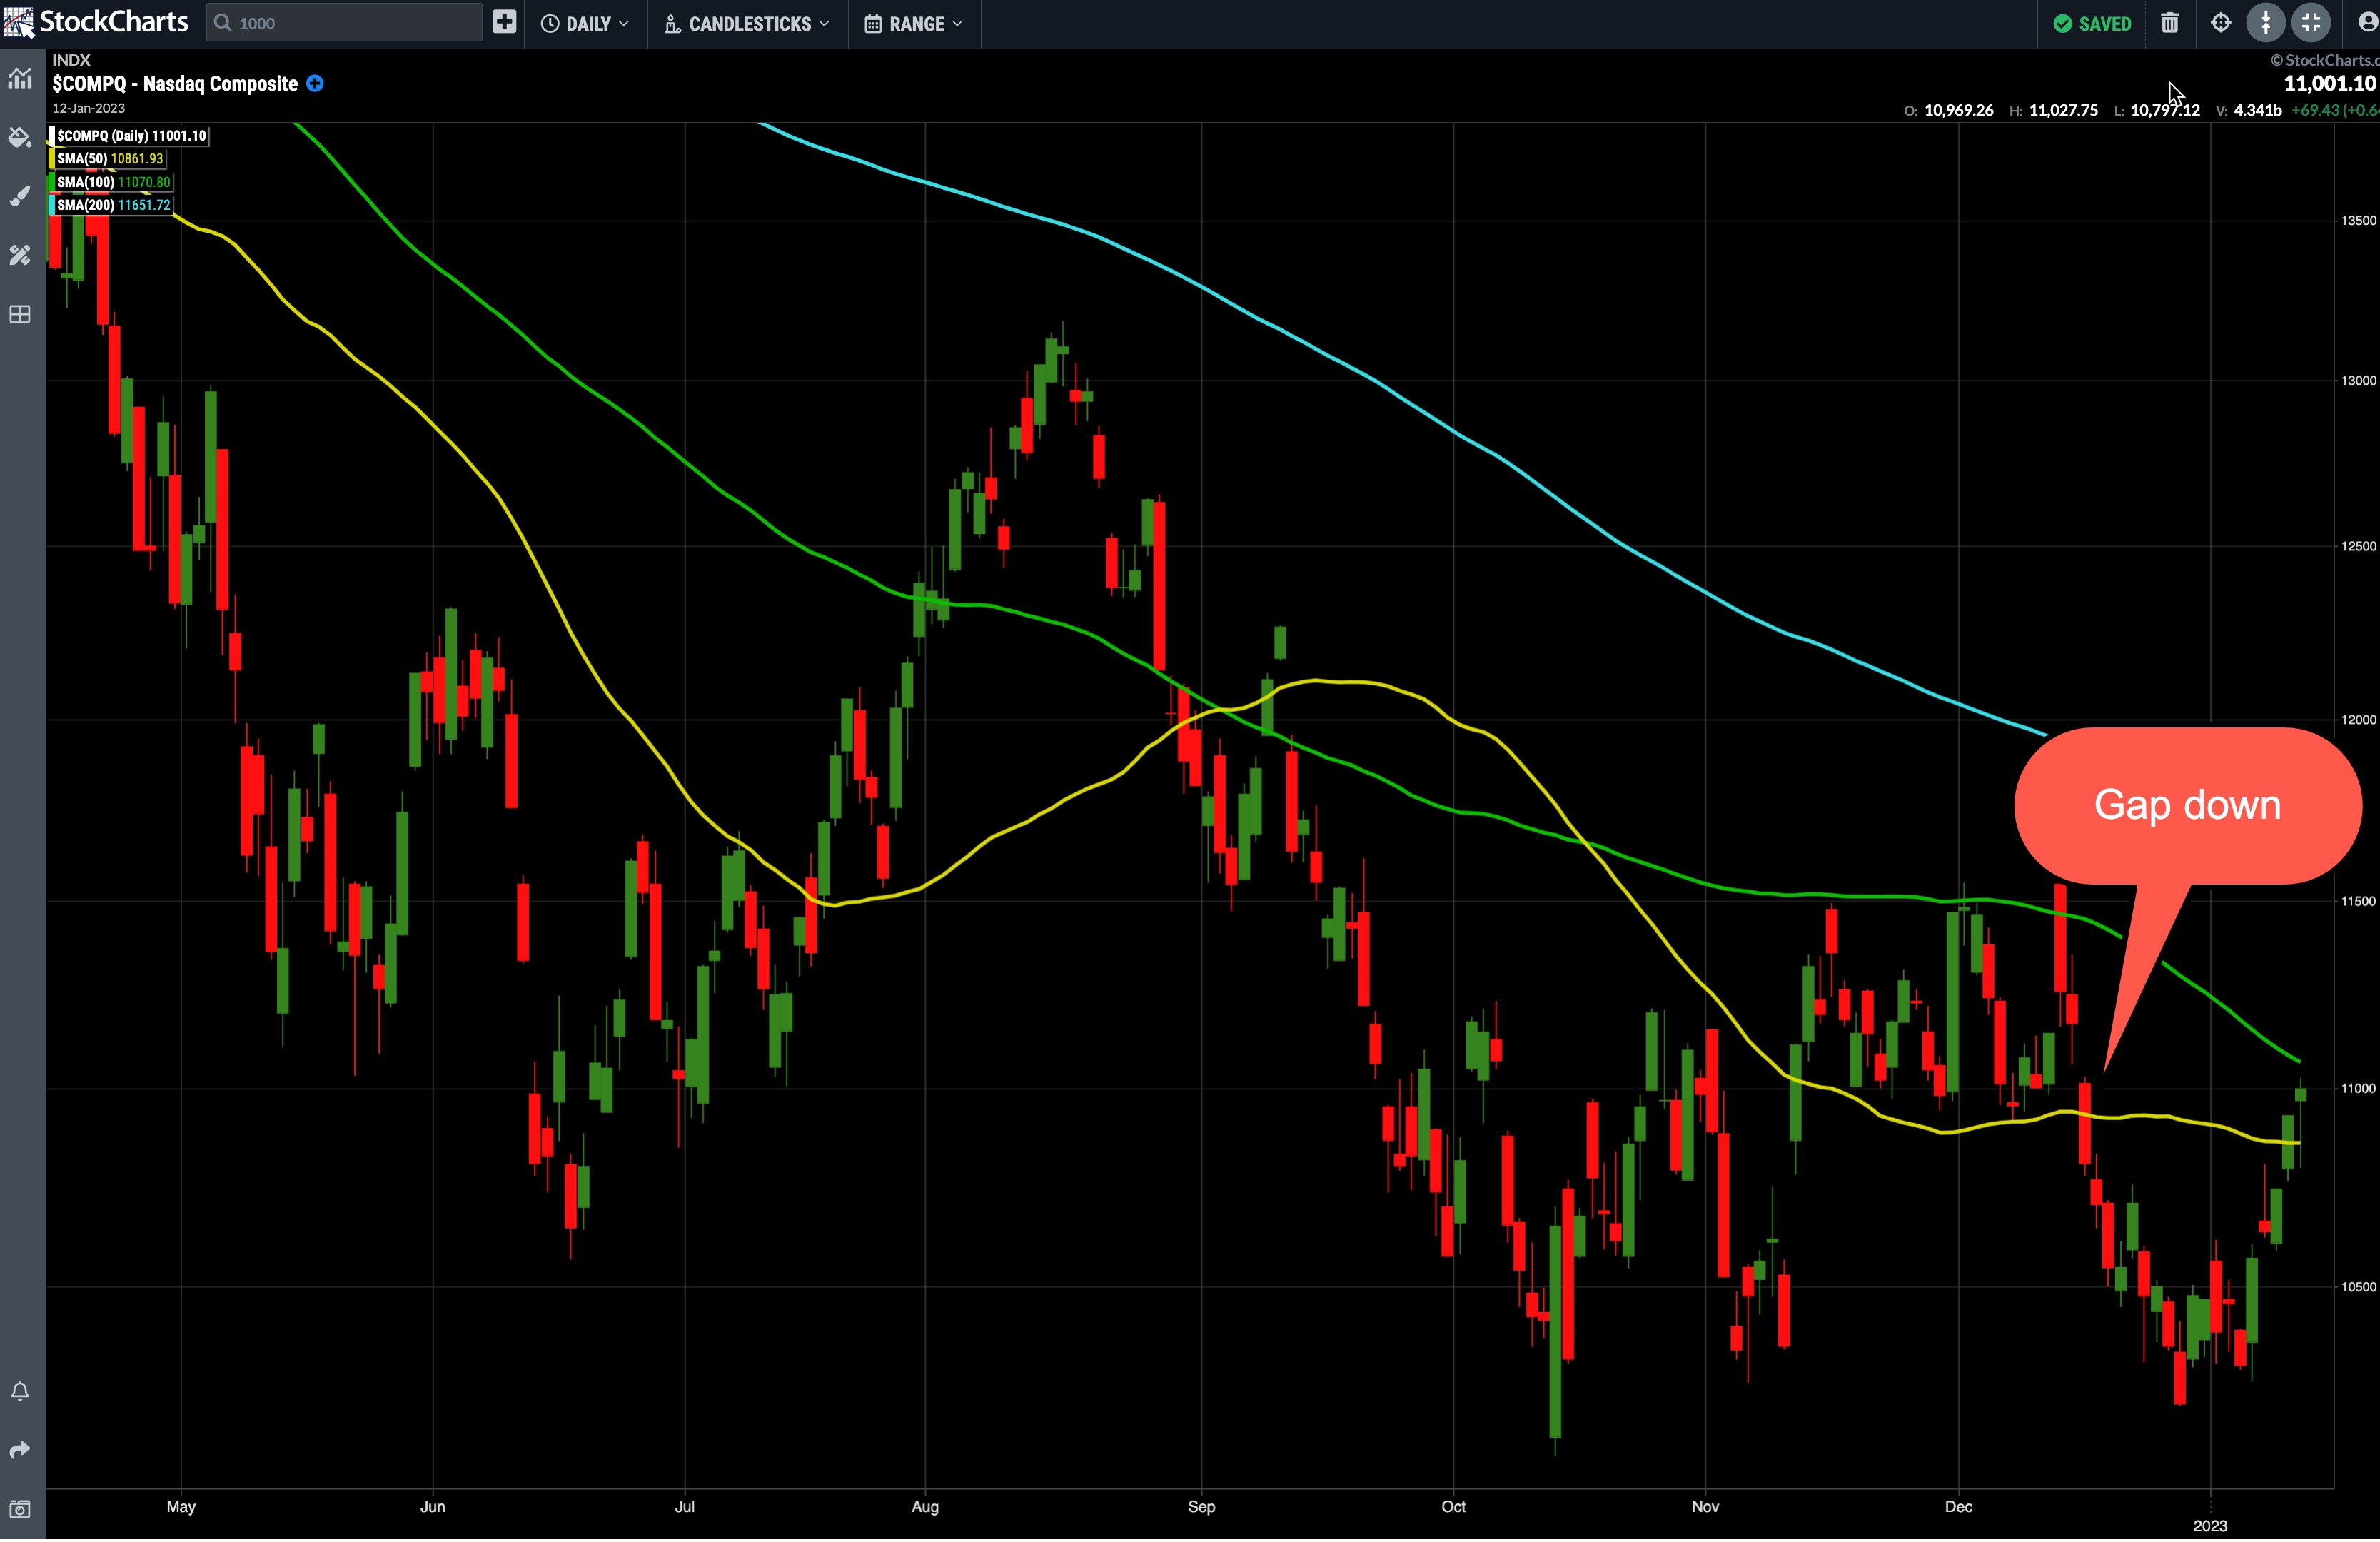
It was nice to see the Nasdaq Composite ($COMPQ) gain a boost and close just above 11,000. Aside from being a round number, this level has some meaning. If you look back at the daily chart of $COMPQ (see Chart 2) on December 15, 2022, you will see that there is a value gap to the 11,000 level. If $COMPQ continues to rise, the gap would be filled and the index could rally to the 11,500 level. The other side of the coin is that the 11,000 level could act as a resistance level and $COMPQ could drop back towards the 10,200 level.

CHART 2: NASDAQ COMPOSITE AT CRITICAL LEVEL. Will it break above 11,000 and fill its December 15 gap or will it bounce off the level and move lower? Something to keep an eye on over the next few days. Chart source: StockChartsACP. For illustration only.
Investors are still cautious
Positive news is great, especially after a super volatile market in late 2022. But anything can happen during earnings season. So tread carefully, keep an eye on your technical indicators and make risk management a priority.
Jayanthi Gopalakrishnan
Director, Website Content
StockCharts.com
Disclaimer: This blog is for educational purposes only and should not be construed as financial advice. The ideas and strategies should never be used without first assessing your own personal and financial situation or without consulting a financial professional.
Happy charting!

Jayanthi Gopalakrishnan is Director of Site Content at StockCharts.com. She spends her time creating content strategies, providing content to educate traders and investors, and finding ways to make technical analysis fun. Jayanthi was Managing Editor at T3 Custom, a content marketing agency for financial brands. Prior to that, she was senior editor of Technical Analysis of Stocks & Commodities magazine for over 15 years.
learn more


