Are the major stock indices under accumulation? If so, we Wyckoffians would expect some major markup (uptrend) to follow. Accumulation is the process by which large interests (known as composite operators) covertly absorb shares of stocks that they expect to rise during the subsequent markup phase. It may take an indefinite amount of time for an accumulation to form. The CO will systematically accumulate its “stock line” during this trendless price structure. Eventually, a greater number of institutional investors will begin to compete for the remaining stock supply, suggesting that absorption (and therefore accumulation) is nearing completion. The law of supply and demand works here. Demand is increasing and supply has been largely absorbed. This imbalance will eventually throw the stocks and the market into a new uptrend.
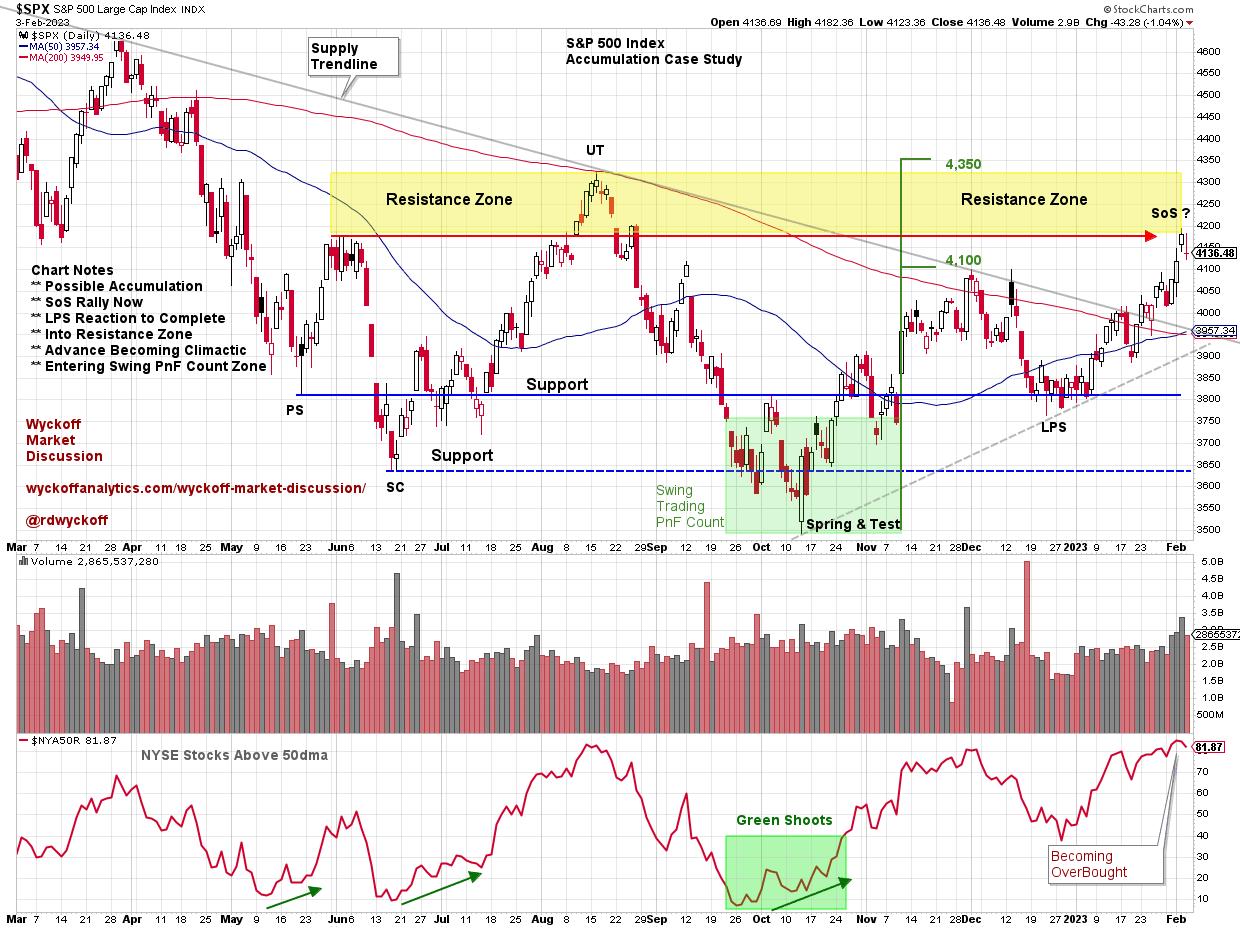
The S&P 500 Index has been range bound since May 2022. The index is now approaching the late May peak, which we define as resistance. May support and resistance largely contained trading as the price was unable to meaningfully exit this zone to start a new trend. Now $SPX has recovered to the May 22 resistance level. Is the absorption almost complete, which would allow the markup to continue from here? Below is a chart study of $SPX:

S&P 500 Index ($SPX) accumulation study
Chart Notes:
- Preliminary Support (PS) and Selling Climax (SC) stop the decline in May and June.
- Spring & Test in October comes at the end of Q3.
- Two stage rally leads to resistance zone and meets swing trading PnF target.
- The supply trendline defined the 2022 bear trend move and was eventually surpassed in January.
- Positive latitude divergence or green shoots appear as Spring & Test develops.
 Point & Figure Case Study on the S&P 500 Index
Notes on the PnF diagram:
- Range bound since May. Is there an accumulation?
- Swing PnF Count generates Spring & Test in Q3.
- The minimum swing count target was reached as $SPX enters the resistance zone.
- A small sign of strength (mSOS) developed as $SPX surpassed the December high.
- The index simultaneously accelerated into the mSoS, the resistance zone and the minimum PnF number.
- Watch for a possible reaction with increasing volume to signal exhaustion of the rally.
- Price momentum could accelerate to the upper target zone of 4,350 PnF. That would be positive.
- Watch for a key sign of strength (MSoS) above the August high (4,300).
- After an MSoS, the next thing to expect would be a Last Point of Support (LPS) or Backup (BU).
- Once an LPS or BU is identified, the accumulation can become a markup.
Caution should be exercised in the resistance area of a trading range. Traders need to consider the possibility of a continuation of the downtrend in an ongoing bear market. The Fed is campaigning to raise interest rates, which is a normal bear market backdrop. We have seen a strong widening rally off the 3rd quarter lows. The PnF horizontal counting technique has taken a good look at the target price that was recently achieved.
Wyckoffians are “tape readers”. Therefore, we will look to the reduced spread and volume characteristics that accompany a reaction into an LPS or BU. These events would confirm late-stage accumulation and would be a starting point for positioning stocks for a more important markup phase.
All the best,
Bruce
@rdwyckoff
Disclaimer: This blog is for educational purposes only and should not be construed as financial advice. The ideas and strategies should never be used without first assessing your own personal and financial situation or without consulting a financial professional.
Power charting video
The latest Power Charting video focuses on finding the leadership of Industry Groups. This case study features the Semiconductor Group. A simple scan is used to identify leading stocks.
Find a leadership position in semiconductors
Learn more about Wyckoff accumulation
(Click here) And (Click here)
Notice
In the weekly Wyckoff Market Discussion (WMD), Roman Bogomazov and I present key markets from a Wyckoff perspective. To learn more and join our Wyckoff community, go to (Click here).

Bruce Fraser, an industry-leading “Wyckoffian,” began teaching graduate courses at Golden Gate University (GGU) in 1987. Working closely with the late Dr. Henry (“Hank”) Pruden, he developed curriculum for and taught many courses in GGU’s Technical Market Analysis Graduate Certificate Program, including technical analysis of securities, strategy and implementation, business cycle analysis and the Wyckoff method. For nearly three decades he taught with Dr.
Learn more


