KEY
TAKEAWAYS
- Despite a lot of turmoil, SPY continues to show strong rotations on both weekly and daily RRGs.
- Rising yields have not damaged the stock rally yet.
- Stock/Bond ratio remains strongly in favor of stocks.
After the election, things have hardly settled in the world. New developments in the Ukraine-Russian conflict and the Middle East are still volatile. Worst of all, I am in Redmond, WA this week, where last night’s storm caused a massive power outage in this region.

Needless to say, producing electronic content is a challenge at the moment 😉
But I found a small pocket where things seem to operate decently, so I’ll give it a try.
When market conditions become cloudy, I always like to step back and zoom out to see the big picture.
Weekly Asset Class Rotation
Using Relative Rotation Graphs, I do that, bringing up an RRG for asset classes as plotted at the top of this article. This is a weekly RRG, and the rotations seem pretty straightforward. (Note: I have left out BTC as it is powering way up into the leading quadrant and living a life of its own.) Stocks are the only asset class inside the leading quadrant, and they are on a decent RRG-Heading, suggesting that more relative strength lies ahead.
On the opposite trajectory, we find the three fixed-income-related asset classes in this universe: government bonds, Corporate bonds, and High-Yield bonds. All three are traveling on a southwestern heading and are moving deeper into the lagging quadrant. This suggests further relative weakness for this group in the coming weeks.
We find commodity ETFs and the Dollar Index inside the improving quadrant. DJP and GSG are in the improving quadrant while still in the middle of their respective trading ranges, both in price and relative.
The Dollar index, on the other hand, is interesting, having reached the top of a broad trading range after a significant rally that started at the bottom of that range back in September. It is now pushing against heavy overhead resistance.
Zooming in on the Daily Timeframe
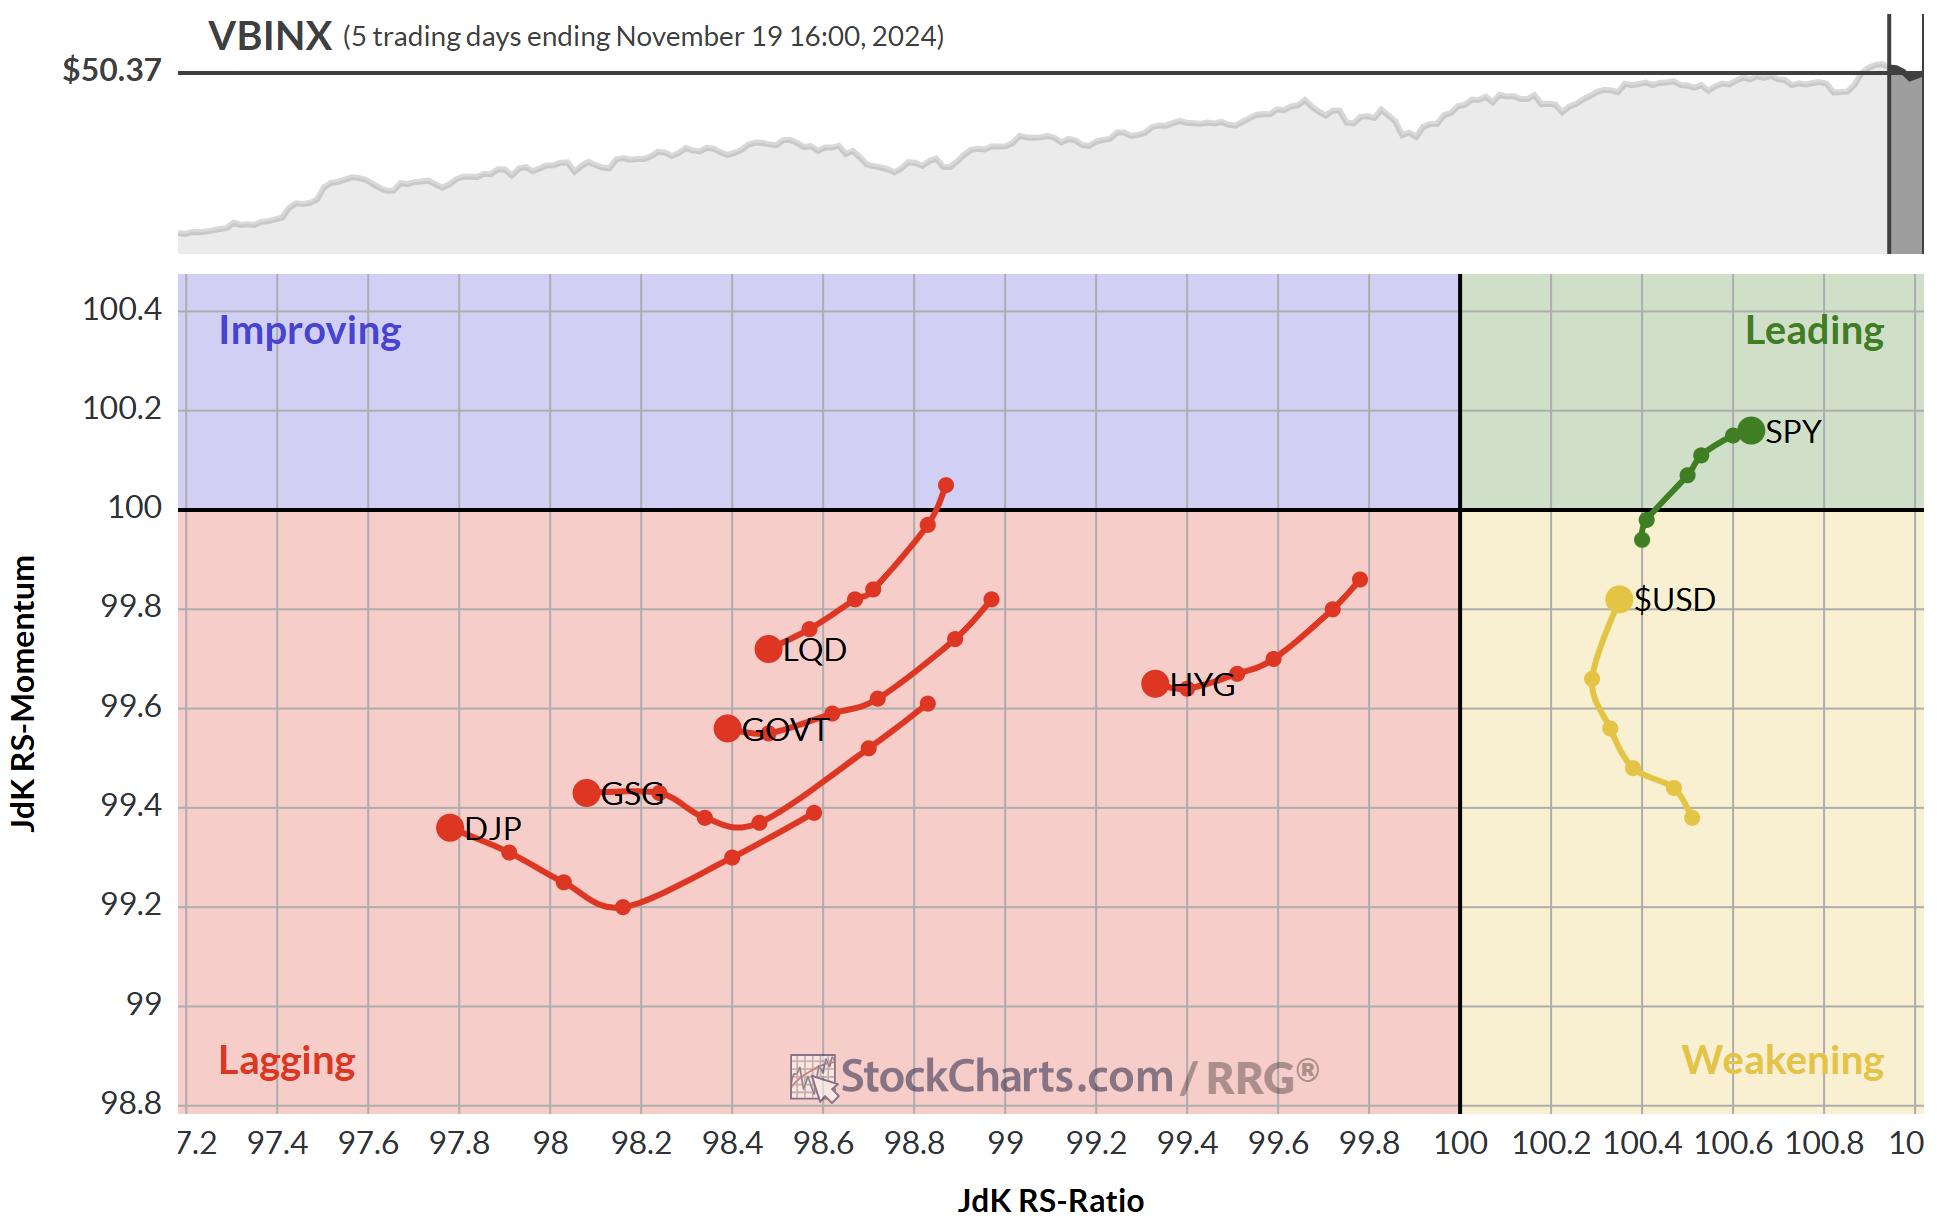
Things are getting more interesting when I zoom in on the daily timeframe. This RRG is plotted above.
A few observations in combination with the rotations as seen on the weekly version. In the daily timeframe, stocks also head deeper into the leading quadrant on a strong RRG heading. This happens after a leading-weakening-leading rotation, which means it is a reasonably reliable start for a new up-leg in the already established relative uptrend. Conversely, the fixed-income asset classes confirm their weaker rotation back into the lagging quadrant after a lagging-improving-lagging rotation.
Overall, the preference for stocks over bonds is firmly shown based on RRG. Commodities are heading further into the lagging quadrant on this daily RRG, which tells me that the positive rotation on a weekly basis might be slowing down soon.
$USD Close to Breaking from Broad Range
This leaves $USD with an interesting rotation. The long tail traveling upward inside the improving quadrant on the weekly is getting support from the leading-weakening-leading rotation that is developing on the daily RRG.
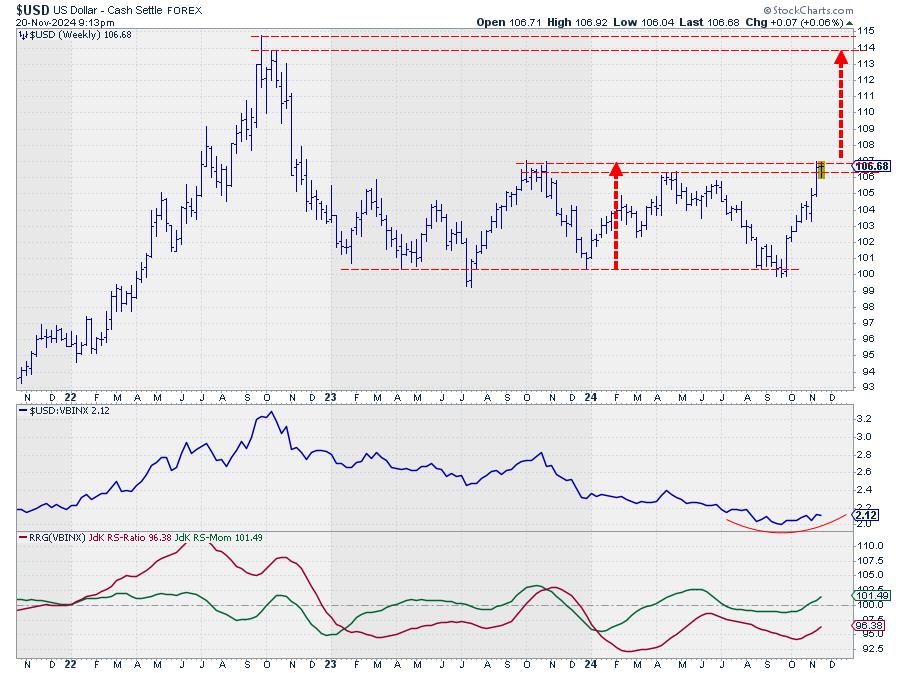
On the price chart, $USD is very close to overhead resistance, and, with its current strength, there is a fair chance of breaking it upward. When that happens, $USD looks set for a strong follow-through that could reach the levels of the previous highs around 114. This target can be calculated by adding the range’s height, around 7 points, to the breakout level, around 107.
Stocks vs. Bonds
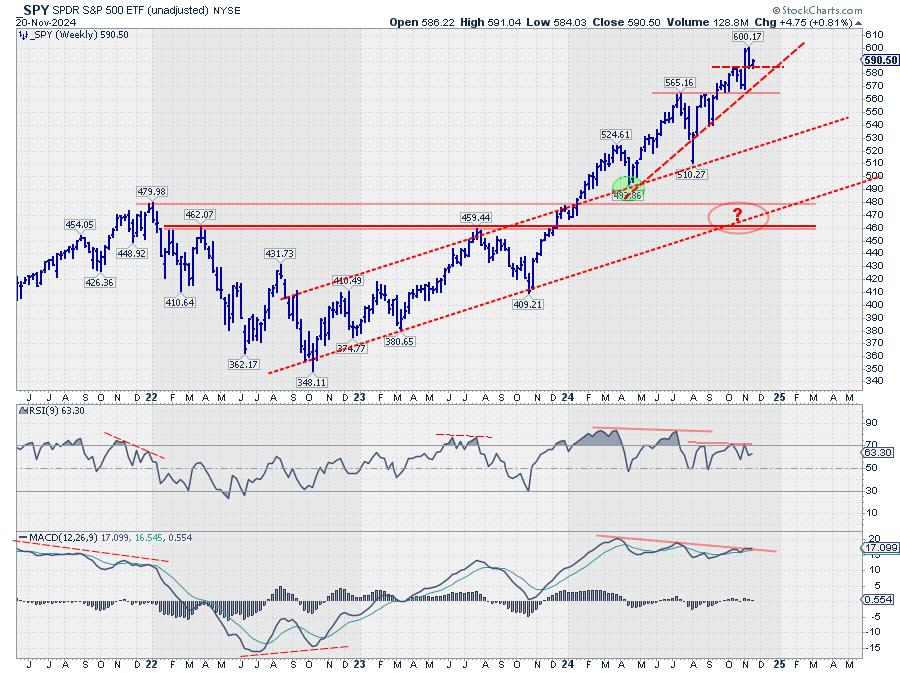
SPY continues to make higher highs and lower lows, confirming its uptrend even though negative divergence is still present and weaker breadth data (not shown here). However, at the end of the day, you can only trade SPY.
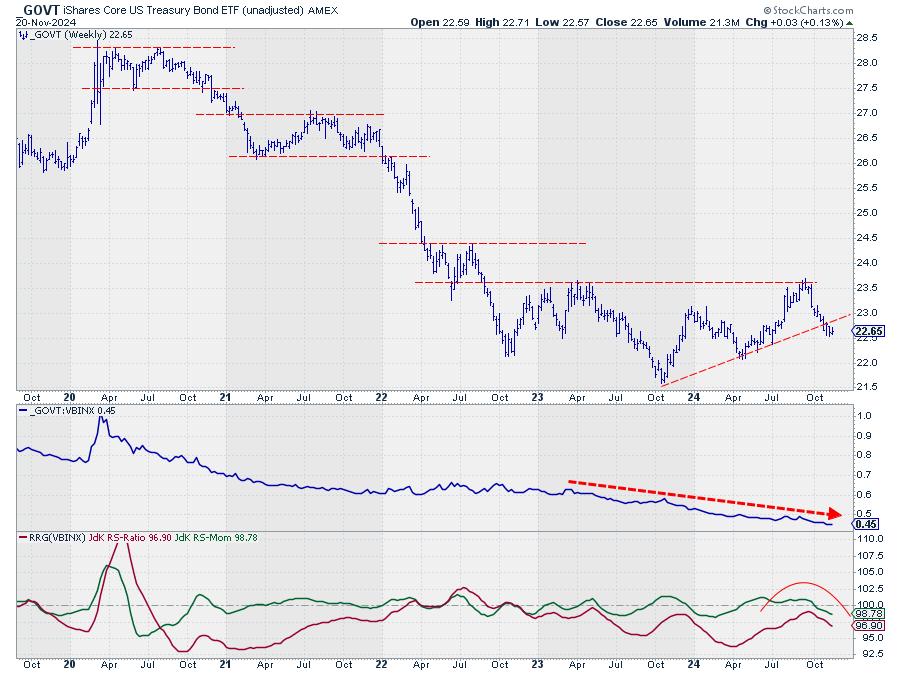
There was a nice rally in bonds, pushing yields down, but the decline of the 23.50 highs seems to be breaking the rising trendline.
The primary relative trend for GOVT vs. VBINX has been down for a long time, and the recent uptick seems to have ended, once again with a high for the JdK RS-Ratio line below 100, resulting in another lagging-improving-lagging rotation, the fifth since late 2022. So far, the rise in yields has not been damaging to stocks, and as a result, the stock-bond ratio has again accelerated in favor of stocks.
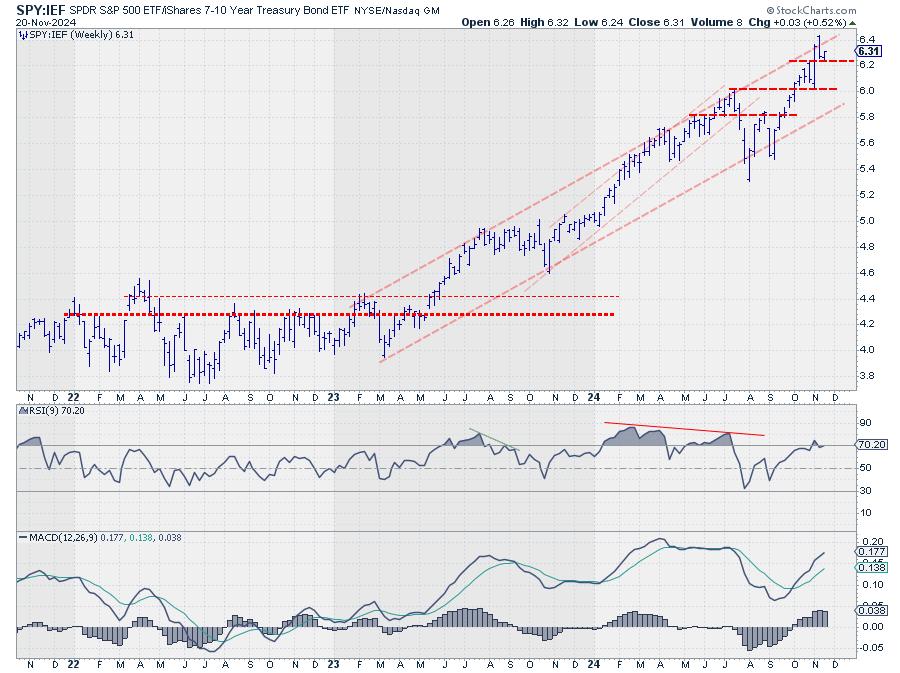
Overall, the preference for stocks over bonds continues while $USD seems to be setting up for a perfect rally!!
#StayAlert –Julius
Julius de Kempenaer
Senior Technical Analyst, StockCharts.com
Creator, Relative Rotation Graphs
Founder, RRG Research
Host of: Sector Spotlight
Please find my handles for social media channels under the Bio below.
Feedback, comments or questions are welcome at Juliusdk@stockcharts.com. I cannot promise to respond to each and every message, but I will certainly read them and, where reasonably possible, use the feedback and comments or answer questions.
To discuss RRG with me on S.C.A.N., tag me using the handle Julius_RRG.
RRG, Relative Rotation Graphs, JdK RS-Ratio, and JdK RS-Momentum are registered trademarks of RRG Research.

Julius de Kempenaer is the creator of Relative Rotation Graphs™. This unique method to visualize relative strength within a universe of securities was first launched on Bloomberg professional services terminals in January of 2011 and was released on StockCharts.com in July of 2014.
After graduating from the Dutch Royal Military Academy, Julius served in the Dutch Air Force in multiple officer ranks. He retired from the military as a captain in 1990 to enter the financial industry as a portfolio manager for Equity & Law (now part of AXA Investment Managers).
Learn More


