KEY
TAKEAWAYS
- NVDA’s stock price has retested its $130 support level and bounced higher, which could provide a bullish trading opportunity using options.
- NVIDIA’s fundamentals are compelling and support a rise in its stock price.
- Selling a put vertical spread provides a limited-risk scenario with a high probability of profit.
As demand for advanced computing and artificial intelligence continues to surge, NVIDIA Corp. (NVDA) stands at the forefront of this revolution, with recent NVDA stock price action suggesting it may offer a compelling bullish opportunity. In this post, we’ll explore the technical and fundamental factors contributing to the bullish outlook in NVDA and how to structure an options strategy—all identified using the OptionsPlay Strategy Center within StockCharts.com.
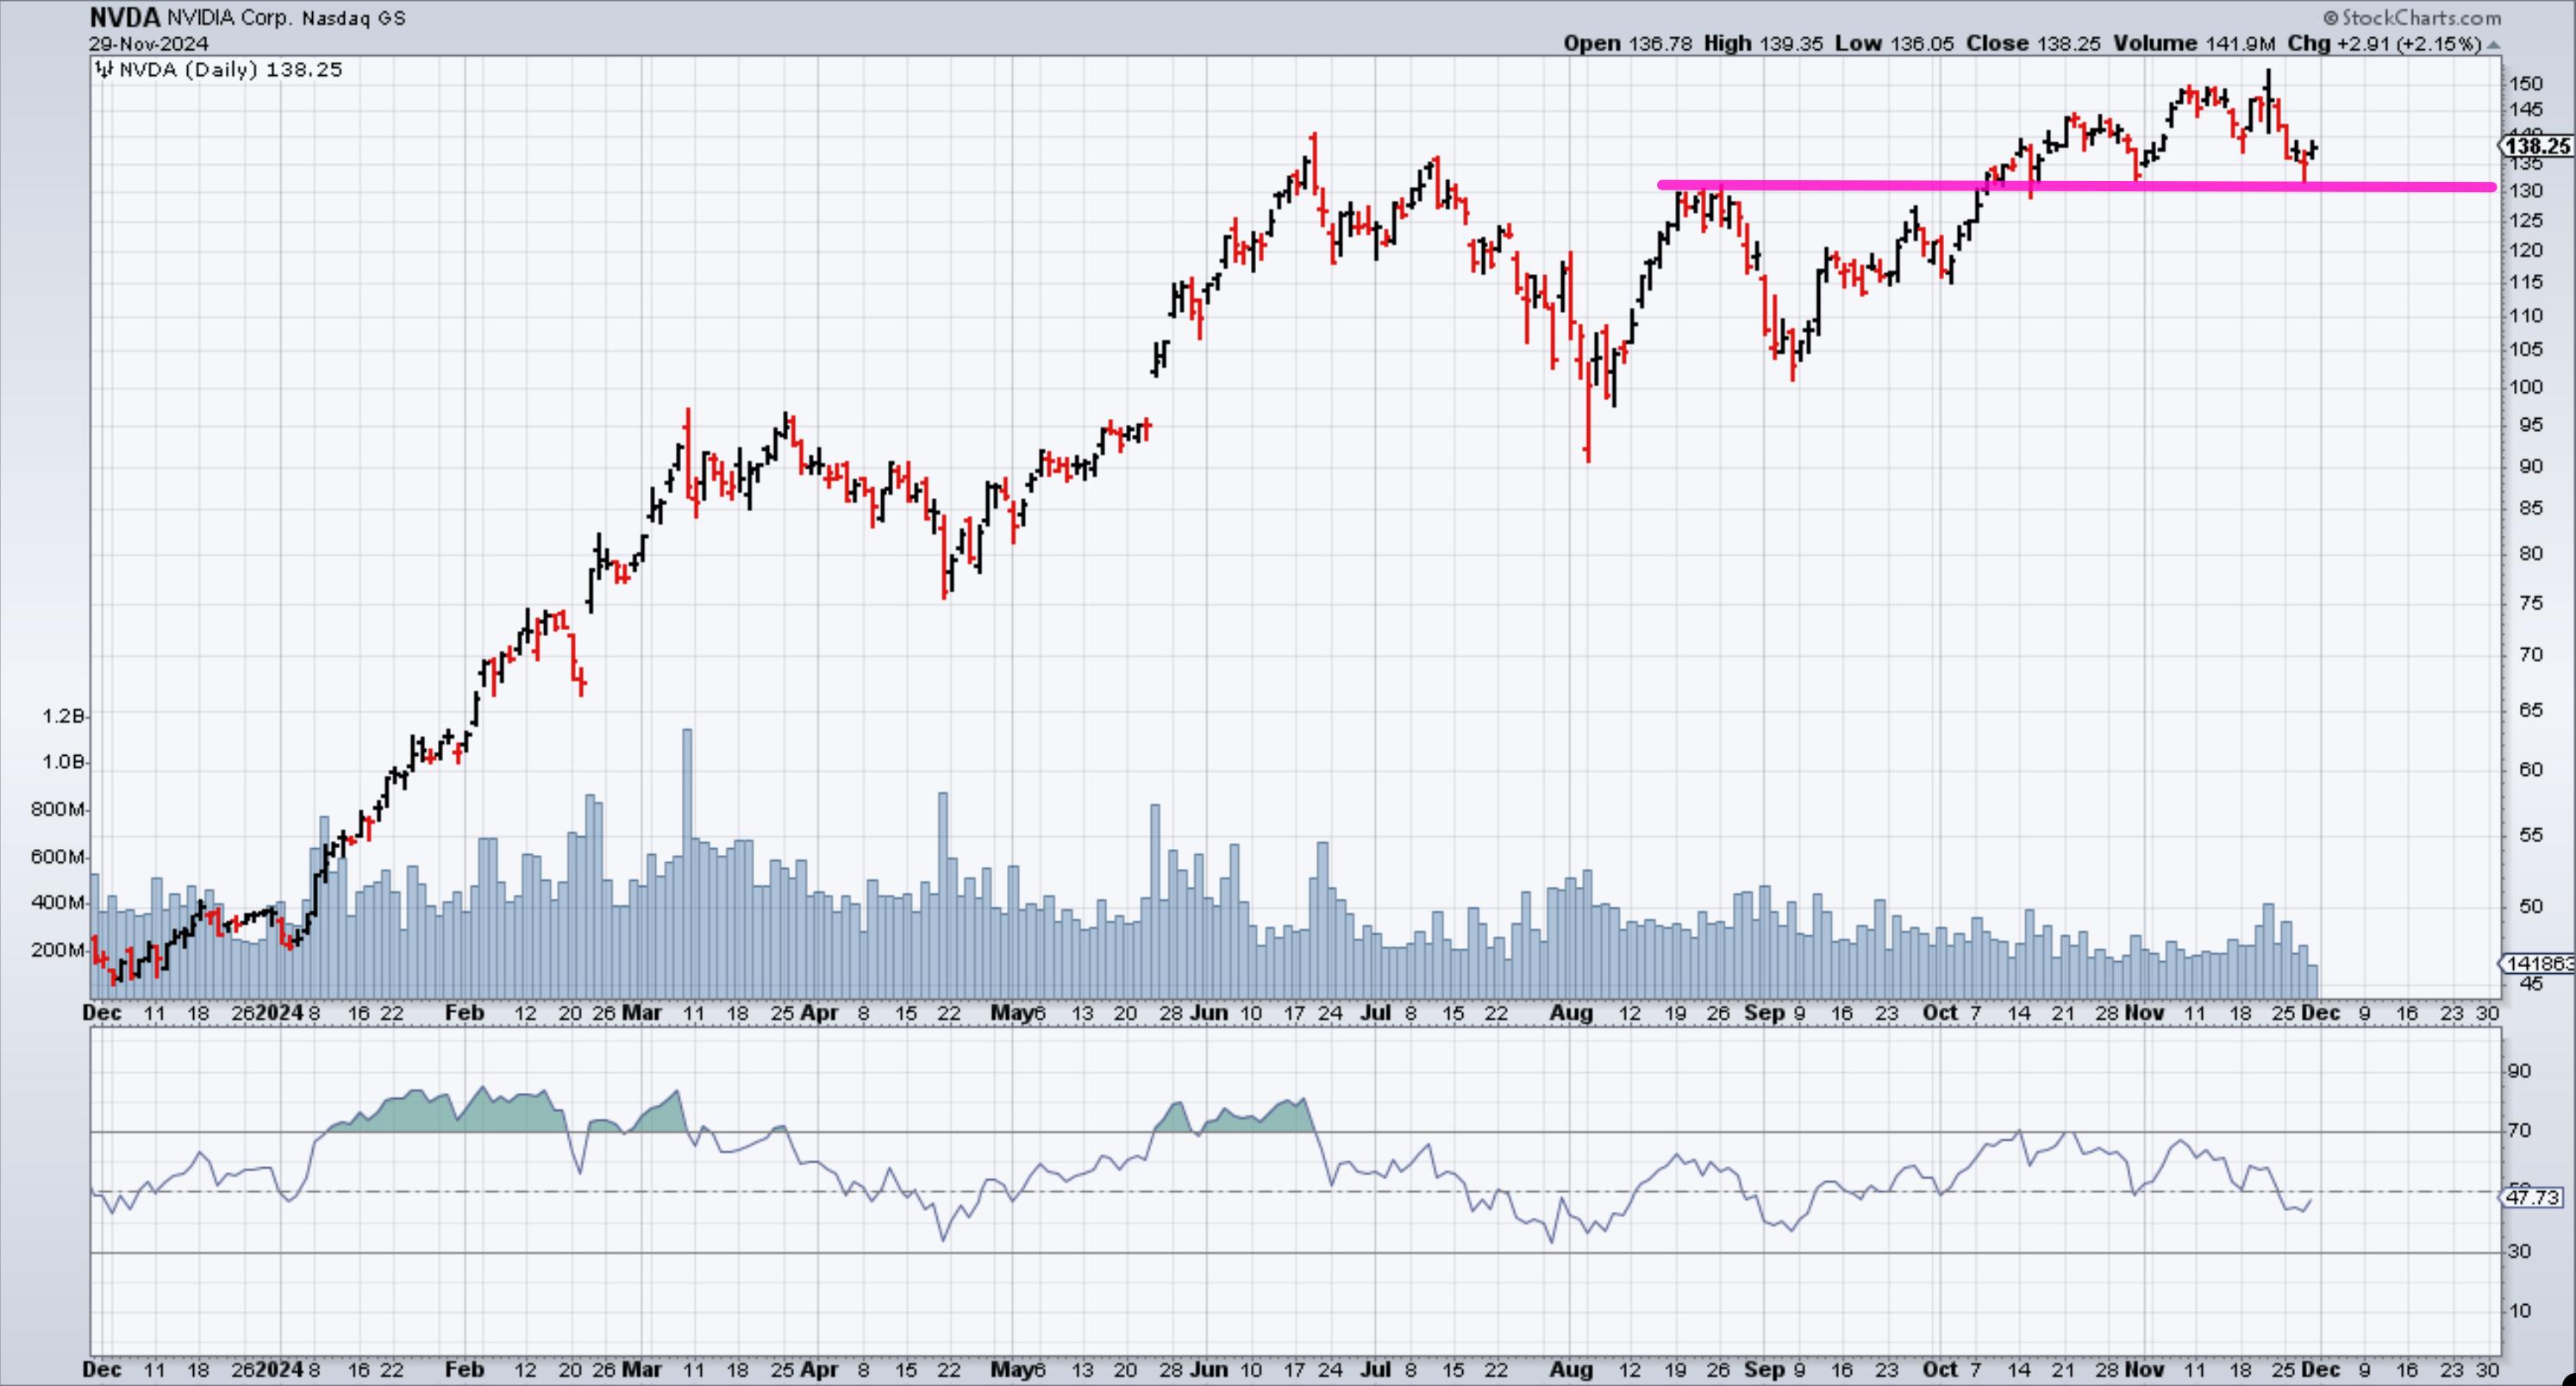
If you look at the NVDA stock price chart below, there are several bullish indicators:
- Retesting Support at $130. After breaking out above the significant resistance area of $130 in October, NVDA has retested this level as support twice.
- Strong Risk/Reward Setup. The successful retests present a favorable risk/reward for bullish exposure.

FIGURE 1. DAILY CHART OF NVDA STOCK PRICE. Since October, NVDA has retested the $130 support level.Chart source: StockCharts.com. For educational purposes.
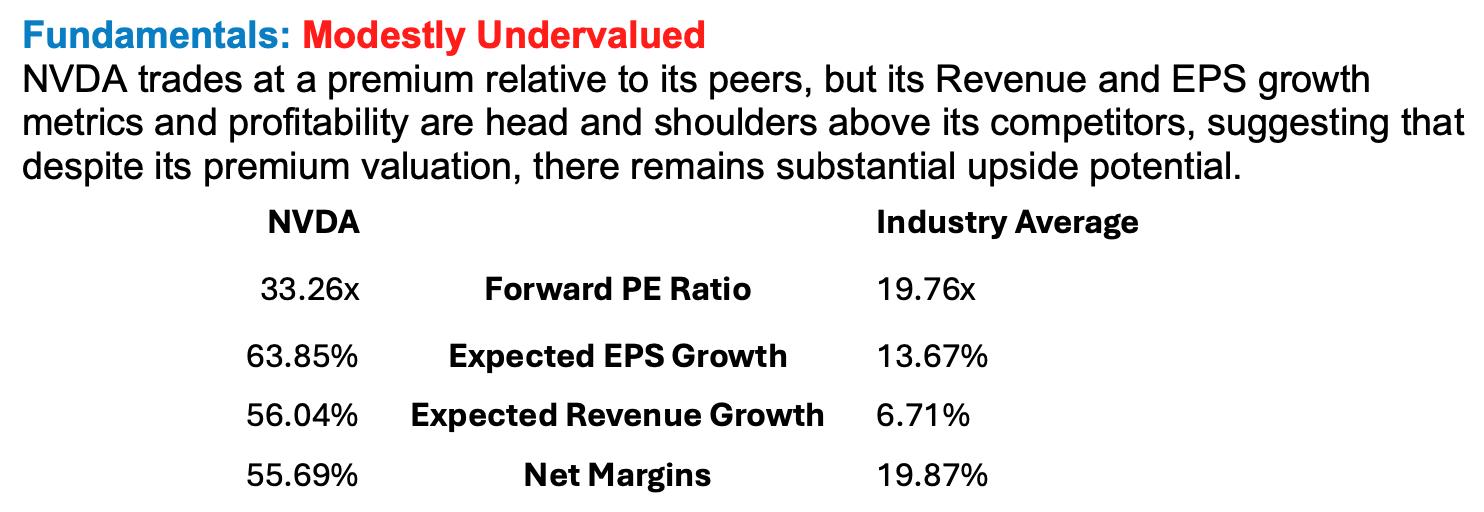
NVDA’s valuation further strengthens the bullish thesis:
- Attractive Valuation. Despite trading at 33x forward earnings, which is a 60% premium relative to the industry, the valuation is justified by NVDA’s outstanding growth metrics and market leadership.
- Exceptional EPS Growth. NVDA’s expected earnings per share (EPS) growth is nearly five times higher than its peers.
- Robust Revenue Growth. NVDA’s expected revenue growth is about 8 times higher than the industry median, indicating superior performance in expanding its market share and business operations.
- Leading Net Margins. With net margins of 55%, NVIDIA leads the industry, showcasing its ability to convert revenue into profit effectively.
- Dominant Position in AI and Accelerated Computing. NVIDIA’s Q3 FY2025 results underscore its leadership in artificial intelligence and accelerated computing sectors, with record revenues and significant growth in data center operations.

FIGURE 2. NVIDIA FUNDAMENTALS. From a valuation perspective, NVDA’s stock price has the potential to rise further.Image source: OptionsPlay.
Put Vertical Spread in NVDA
Despite a low IV Rank, NVDA options skew provides an opportunity to sell a put vertical spread and still collect over 37% of the width. This provides a neutral to bullish outlook with limited risk and a higher probability of profit.
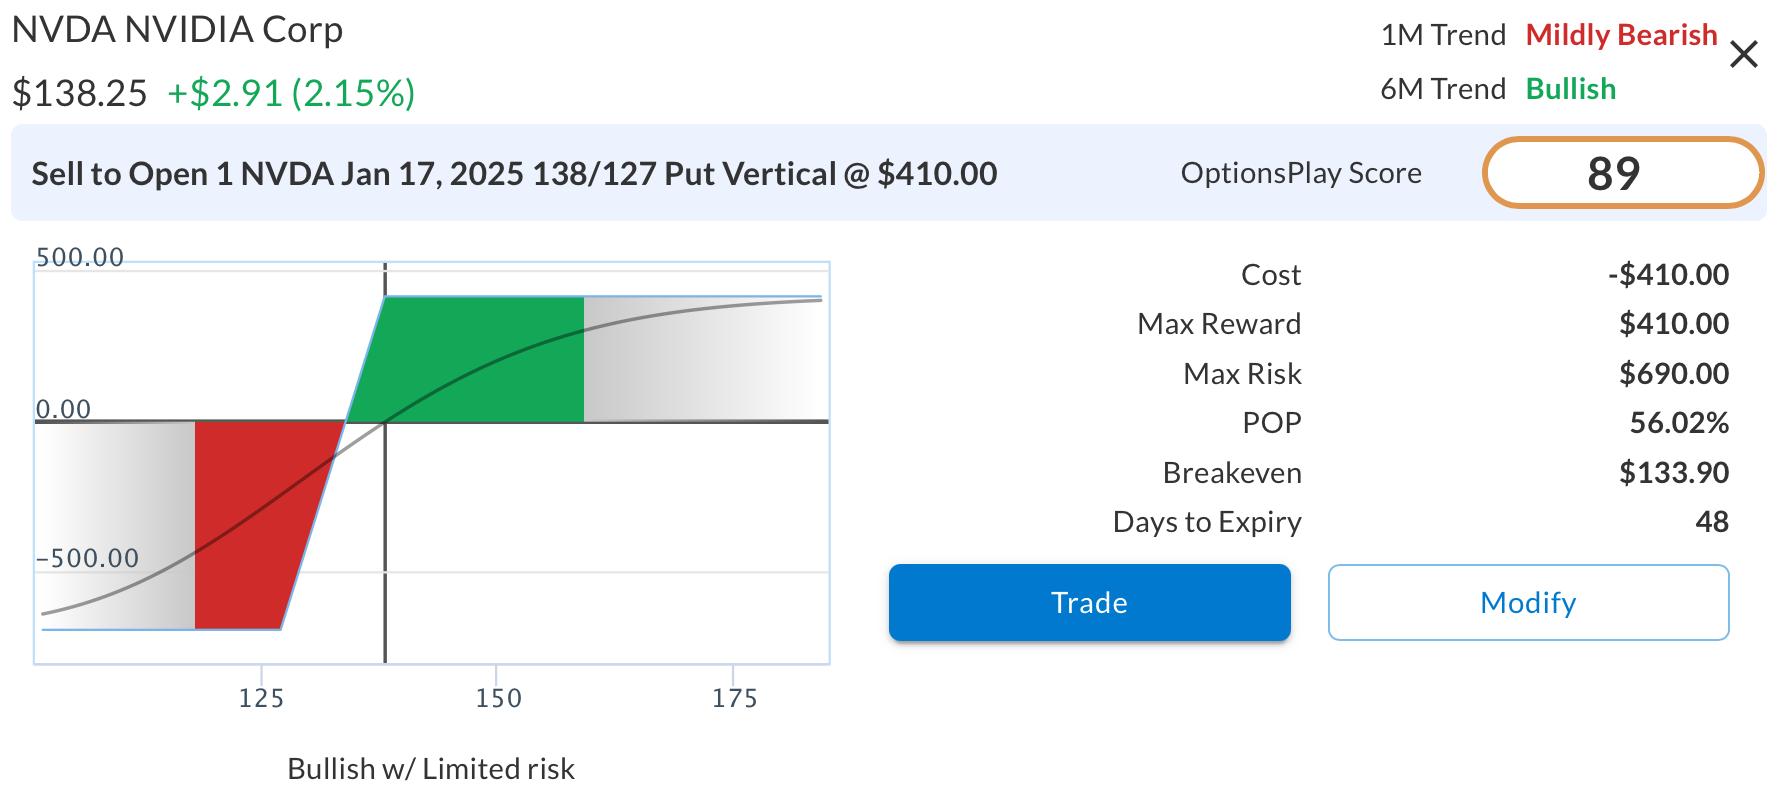
Selling the Jan 2025 $138/$127 Put Vertical @ $4.10 Credit:
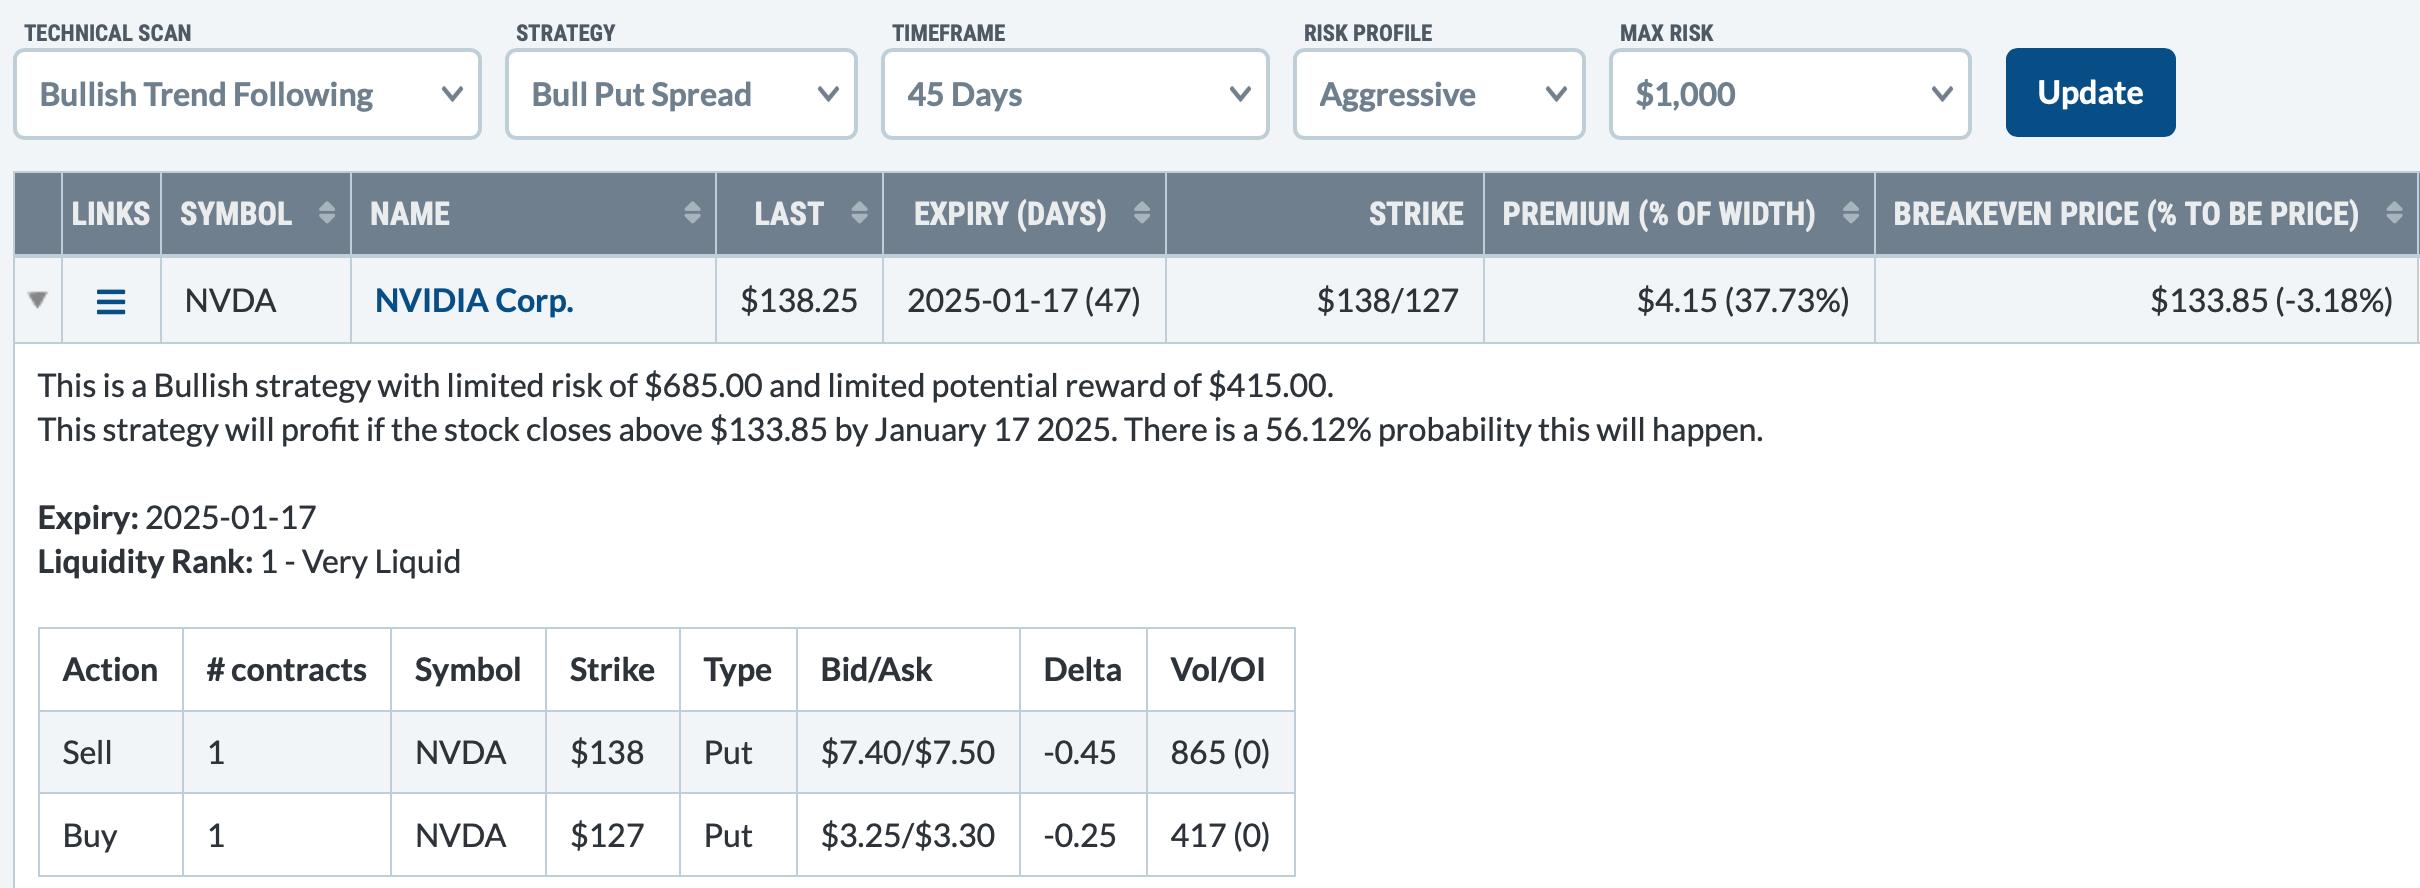
- Sell: January 17, 2025, $138 Put Option at $7.45
- Buy: January 17, 2025, $127 Put Option at $3.35
- Net Credit $410 per contract

FIGURE 3. RISK CURVE FOR SELLING NVDA PUT VERTICAL SPREAD. This strategy provides a neutral to bullish outlook and has a higher probability of profit (POP).Image source: OptionsPlay Strategy Center at StockCharts.com.
A breakdown of selling the put vertical is as follows:
- Potential Reward: Limited to the net credit received or $415.
- Potential Risk: Limited to $685 (the difference between the strike prices multiplied by 100, minus the net credit).
- Breakeven Point: $133.85 (strike price of the sold put minus the net credit per share).
- Probability of Profit: Approximately 56.12% if NVDA closes above $133.85 by January 17, 2025.
The bull put spread benefits from time decay and allows for profit if the stock remains above the breakeven point at expiration. It provides a favorable risk-to-reward ratio aligned with the bullish outlook on NVDA’s stock price.
How To Unlock Real-Time Trade Ideas
This bullish opportunity in NVIDIA was identified using the OptionsPlay Strategy Center within StockCharts.com. The platform’s Bullish Trend Following scan automatically sifted through the market to highlight NVDA as a strong candidate, and it structured the options strategy efficiently.

FIGURE 4. BULLISH TREND FOLLOWING SCAN FILTERED NVDA AS A STRONG CANDIDATE. Here, you see a synopsis of the bull put spread trade for NVDA.Image source: OptionsPlay Strategy Center at StockCharts.com.
By subscribing to the OptionsPlay Strategy Center, you can:
- Discover Opportunities Instantly: Utilize automated market scans to find the best trading opportunities based on real-time data.
- Receive Optimal Trade Structuring: Get tailored options strategies that match your market outlook and risk preferences.
- Save Time with Actionable Insights: Access comprehensive trade ideas within seconds, eliminating hours of research and analysis.
Don’t miss out on potential trading opportunities. Subscribe to the OptionsPlay Strategy Center today and enhance your trading experience with tools designed to keep you ahead in the market. Empower your investment decisions and find the best options trades swiftly every day. Let OptionsPlay be your partner in navigating the markets more effectively.

Tony Zhang is the Chief Strategist at OptionsPlay.com, where he has assembled an agile team of developers, designers, and quants to create the OptionsPlay product suite for trading and analysis. He has also developed and managed many of the firm’s partnerships extending from the Options Industry Council, Nasdaq, Montreal Exchange, Merrill, Fidelity, Schwab, and Raymond James. As a proven thought leader and contributor on CNBC’s Options Action show, Tony shares ideas on using options to leverage gain while reducing risk.
Learn More


