KEY
TAKEAWAYS
- Rotation to Large-Cap Growth is back
- And so is the narrow foundation/breadth supporting this rally
- Weekly and Daily $SPX charts need to get in line
Stronger than expected
The recent rally out of the 5 Aug low is definitely stronger than I had anticipated. I was watching the resistance zone between 5350 and 5400, but that area was passed as if there was no supply whatsoever, at least at the index level.
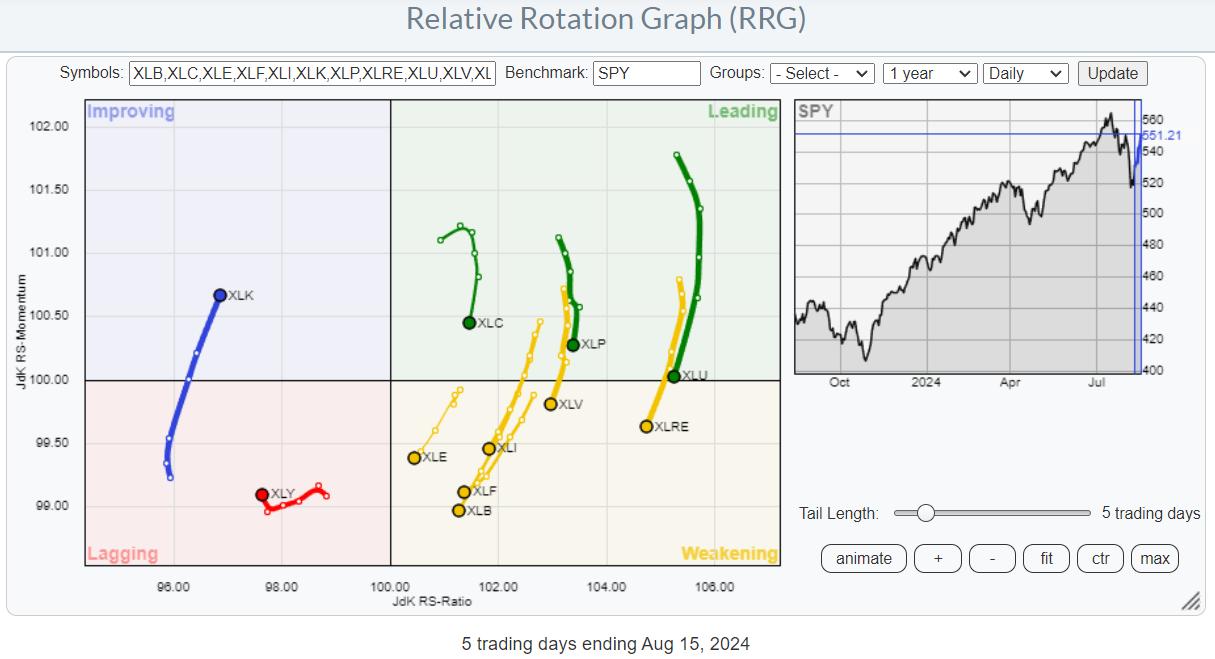
Looking at the sector rotation coming with this move we see the RRG as plotted above.
Technology and, to a lesser degree, Consumer Discretionary are picking up some speed and driving the market higher. And this happens at the cost of relative strength for all other sectors.
The split between relative UP trends, sectors on the right-hand side of the RRG, and relative DOWN trends, sectors on the left-hand side of the RRG, is also very clearly visible.
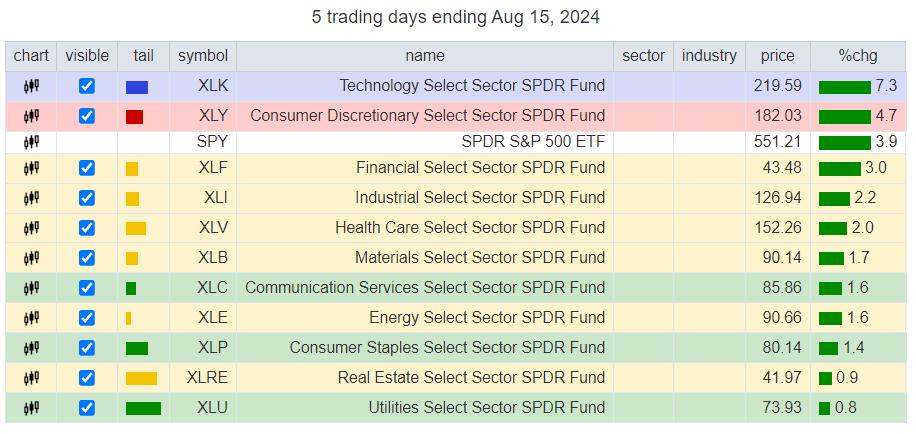
Looking at the performance over the last five trading days, it is clear that the base for this rally is, once again, very narrow. Technology and discretionary are the only two sectors that beat the S&P 500.
Weekly
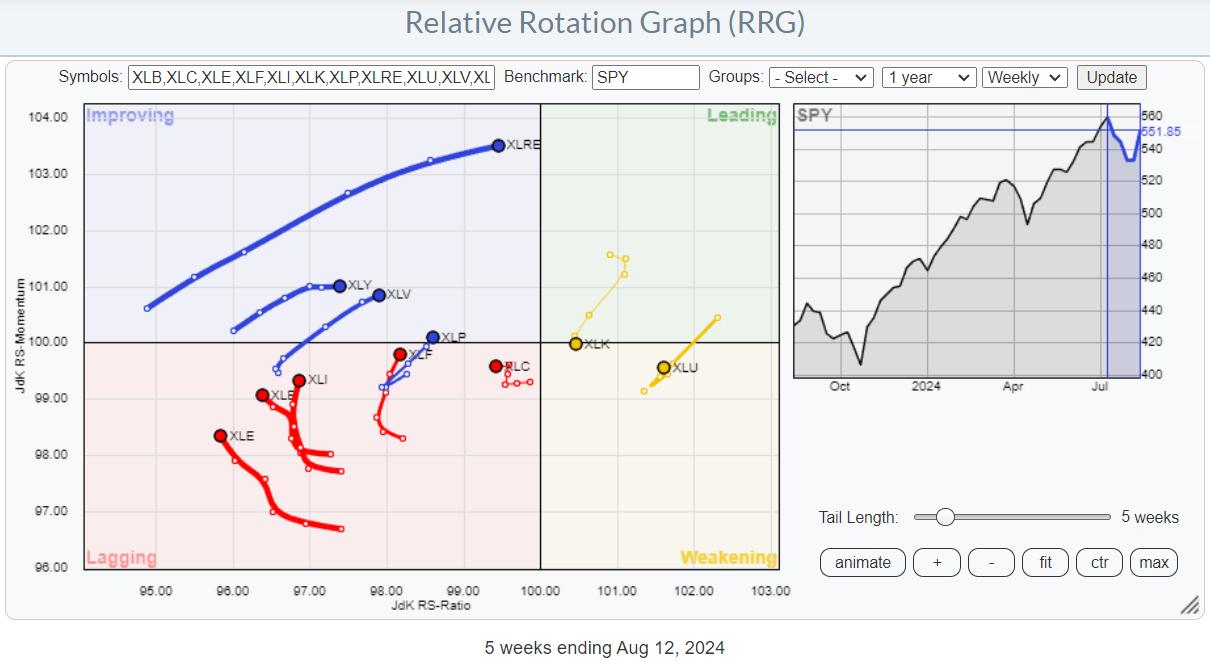
Bringing up the weekly RRG shows a different picture, which is more the opposite of the daily. Technology is the only sector still on a negative RRG-Heading. All others are on a positive RRG-Heading or at least picking up relative momentum.
The big difference is that on this weekly RRG, Technology (and Utes) is the only sector on the right-hand, positive side of the RRG, while all others are on the left-hand, negative side of the chart.
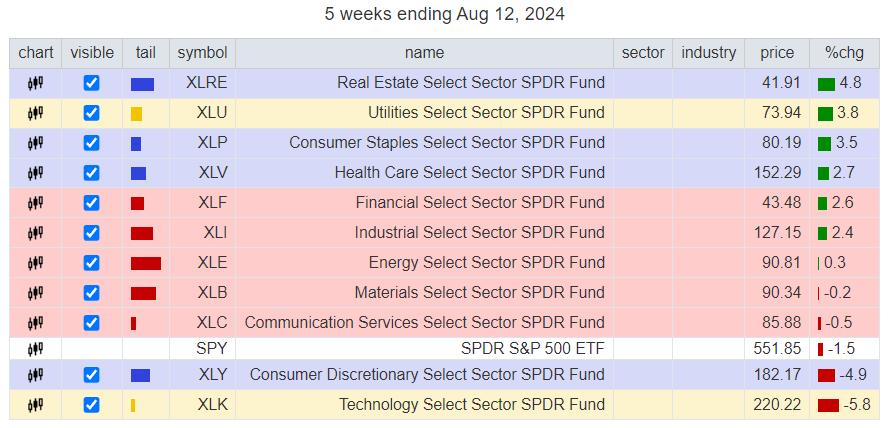
Regarding performance, discretionary and technology are the only sectors underperforming in the S&P 500. All other sectors have beaten the market over the last five weeks.
Combining the info from these two RRGs leads to the belief/conclusion that the Large-Cap-Growth rotation is back, at least temporarily.
Growth-Value-Size
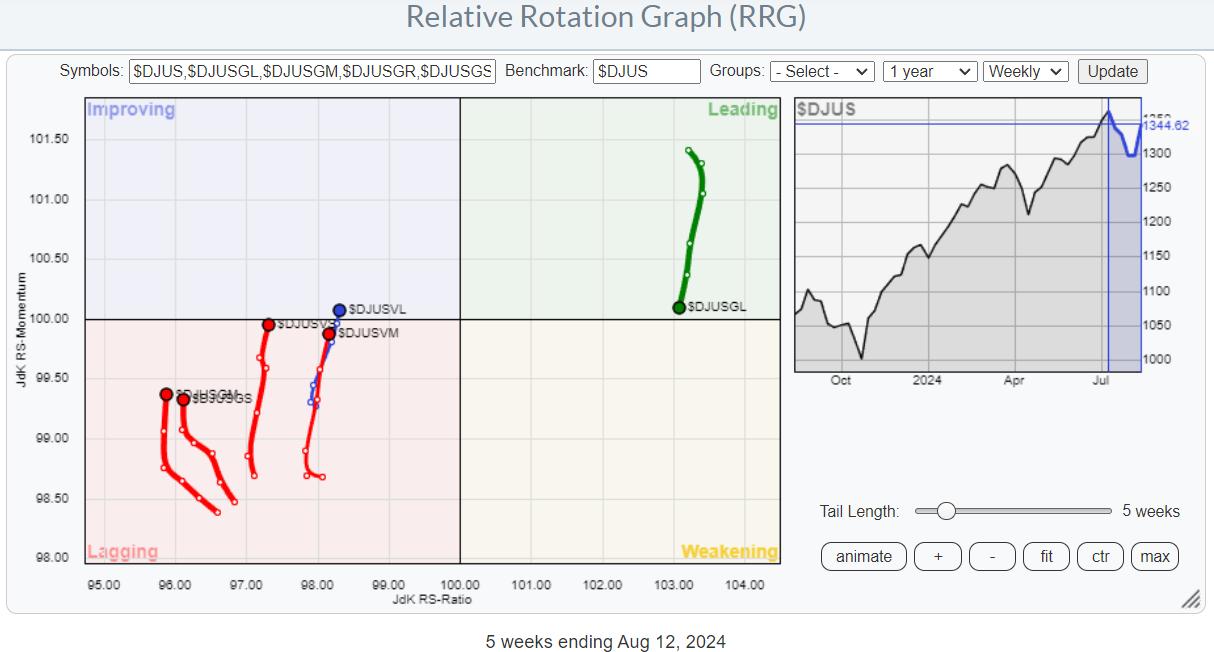
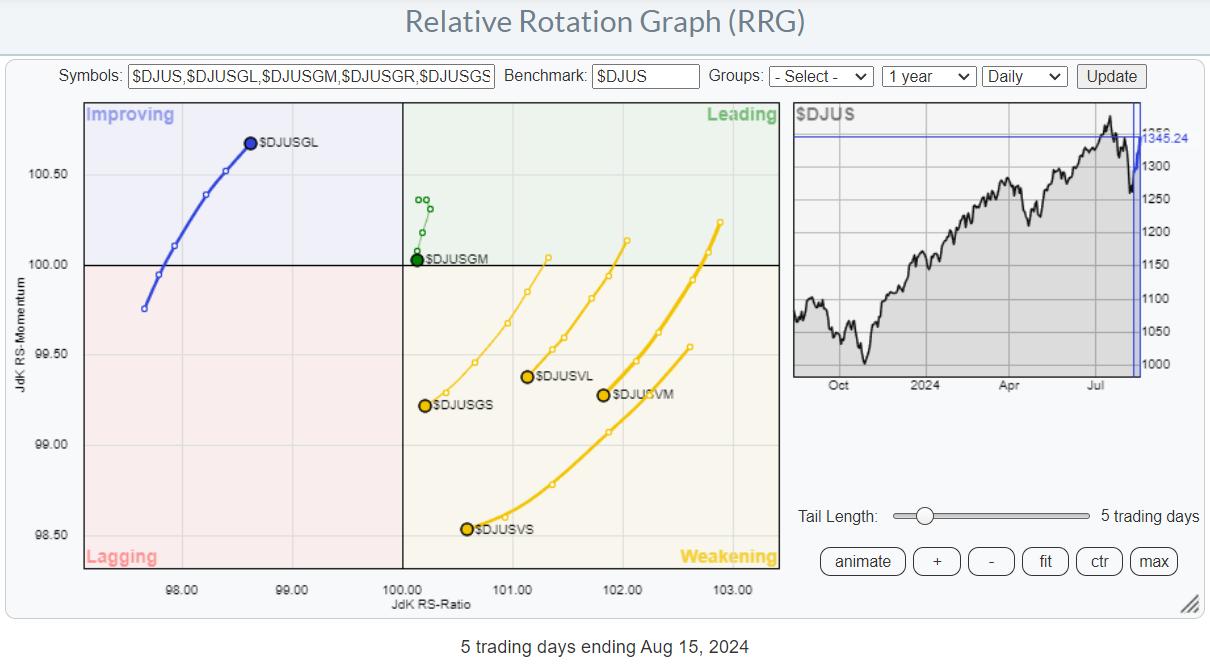
This observation also appears when we examine the weekly and daily RRGs, which show the various market segments broken down into Growth-Value and their respective size segments.
Here also, the weekly RRG shows the rotation OUT of Large-Cap Growth and INTO anything else, at least on a relative basis. The Daily RRG shows the opposite: rotation INTO Large-Cap Growth and OUT of anything else.
All in all, we’re now back to a situation in which market strength is supported only by a very narrow foundation.
That, therefore, brings back the concern of whether this is enough to keep this rally going?
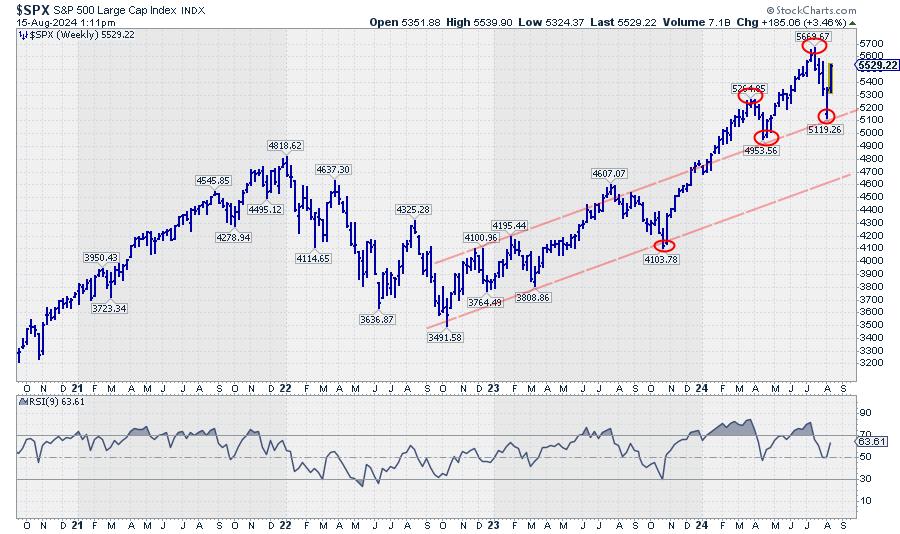
Weekly UPtrend
The series of higher highs and higher lows (UPtrend) is uninterrupted on the weekly price chart.
Daily DOWNtrend
However, the series of lower highs and lower lows (DOWNtrend) is uninterrupted on the daily chart. It looks like this week continues to be critical for the further development in the S&P 500
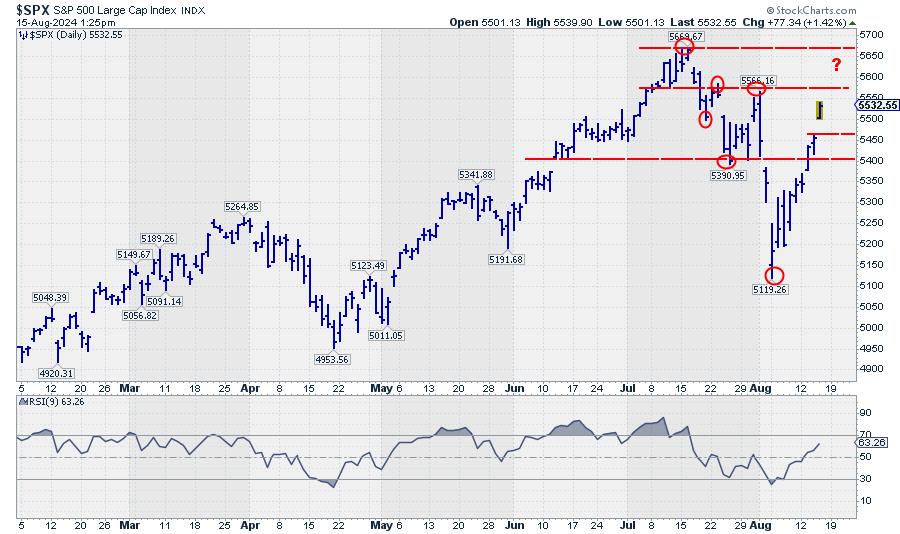
Until either of these situations resolves in the other’s favor, I expect market behavior to remain very tricky.
#StayAlert –Julius
Julius de Kempenaer
Senior Technical Analyst, StockCharts.com
Creator, Relative Rotation Graphs
Founder, RRG Research
Host of: Sector Spotlight
Please find my handles for social media channels under the Bio below.
Feedback, comments or questions are welcome at Juliusdk@stockcharts.com. I cannot promise to respond to each and every message, but I will certainly read them and, where reasonably possible, use the feedback and comments or answer questions.
To discuss RRG with me on S.C.A.N., tag me using the handle Julius_RRG.
RRG, Relative Rotation Graphs, JdK RS-Ratio, and JdK RS-Momentum are registered trademarks of RRG Research.

Julius de Kempenaer is the creator of Relative Rotation Graphs™. This unique method to visualize relative strength within a universe of securities was first launched on Bloomberg professional services terminals in January of 2011 and was released on StockCharts.com in July of 2014.
After graduating from the Dutch Royal Military Academy, Julius served in the Dutch Air Force in multiple officer ranks. He retired from the military as a captain in 1990 to enter the financial industry as a portfolio manager for Equity & Law (now part of AXA Investment Managers).
Learn More


