KEY
TAKEAWAYS
- XLF on strong RRG-Heading, rotating back into leading quadrant
- XLF price approaching overhead resistance after short setback
- Three major financial stocks ready for upward breaks to lead the sector higher
The Relative Rotation Graph for US sectors shows long tails for XLE and XLU. Both are on a strong RRG-Heading toward or into the leading quadrant. Also inside the leading quadrant are XLB and XLI, though they have rolled over and are starting to lose a bit of relative momentum.
Sectors on negative RRG-Heading and inside the lagging quadrant are XLRE, XLY, XLV, and XLK, with the S&P 500 moving higher in the last three weeks.
For this article, I want to focus on the Financials sector (XLF). The tail for XLF just completed a short rotation through the weakening quadrant and is now returning into the leading quadrant.
The Weekly Chart
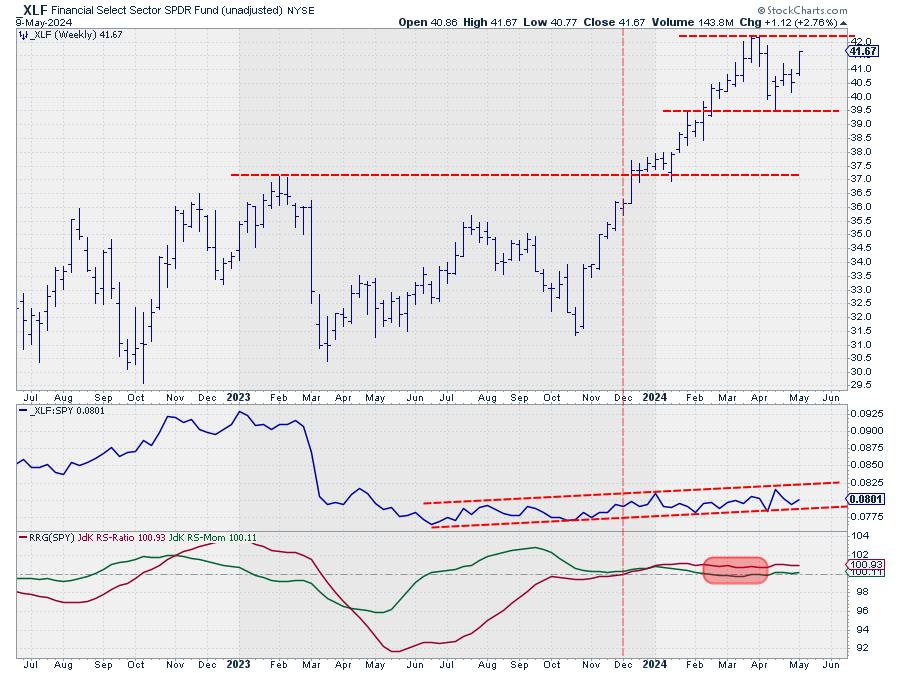
The chart above, in combination with the RS-Line and the RRG-Lines, shows what is happening presently. At the dashed vertical line, both RRG-Lines had crossed above the 100-level, pushing the XLF tail into the leading quadrant on the RRG. At the start of 2024, the green JdK RS-Momentum line started to roll over and lose some strength, causing the XLF tail to roll over while still inside the leading quadrant. At the start of the red-shaded box, the RS-Momentum line dips below 100. This has pushed the XLF tail into the weakening quadrant. Note that the red JdK RS-Ratio line remains above 100. At the end of the shaded box, the RS-Momentum line crosses back above the 100-level, which pushes the tail back into the leading quadrant.
When you study the raw RS-Line, you see that it is moving inside a narrow uptrend channel. The period covered by the shaded area reflects a flat period of relative strength inside that channel, after which the rhythm of higher highs and higher lows continues. This rotation on the RRG reflects the continuation of an existing relative uptrend, making it much less risky than the turnaround from a downtrend to an uptrend, which happened at the dashed vertical line.
The Daily Chart
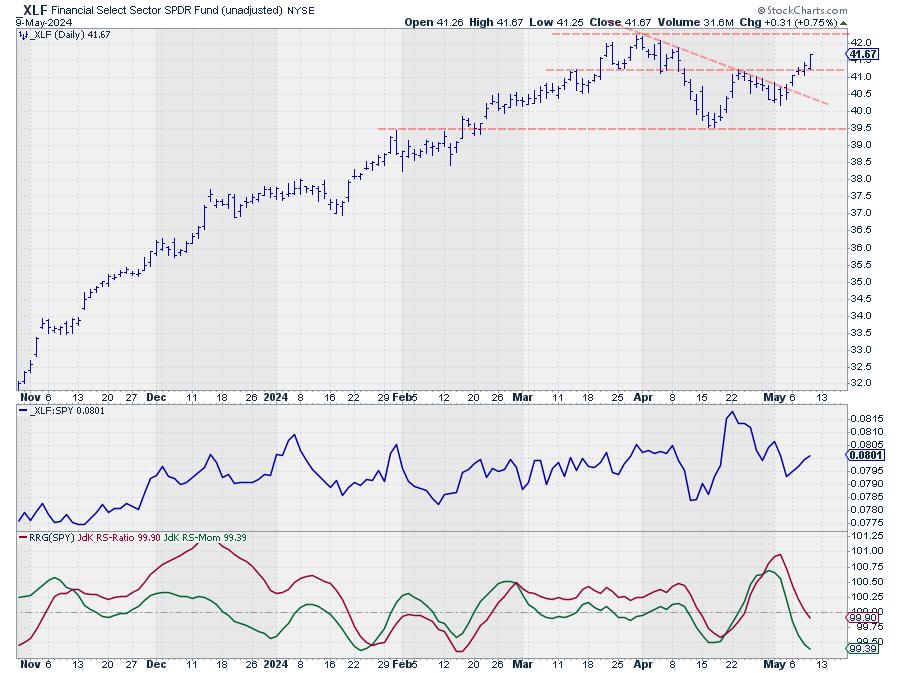
The recent dip to 39.50 and the subsequent rally show up in more detail on the daily chart. This week, XLF takes out its most recent high, starting a new series of higher highs and higher lows. The next resistance level is at the all-time high of 42.20 at the end of March. The setback off of that all-time high has caused relative strength to correct slightly, causing the (daily) RRG-Lines to dip below 100 and push the XLF tail into lagging on the daily RRG.
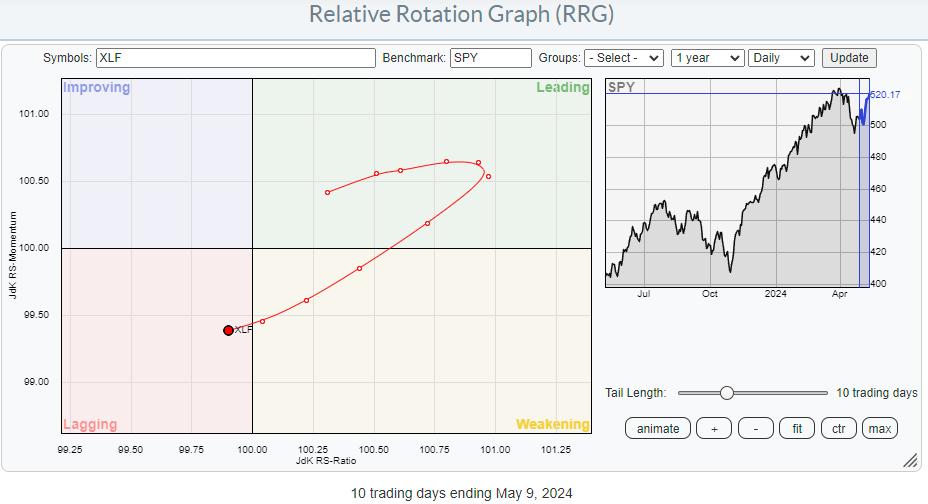
With the price chart already back on the way up, relative strength is expected to follow shortly. As soon as the daily tail starts to turn back into a 0-90 degree RRG-Heading, relative strength for XLF is expected to improve further, making it one of the leading sectors in the S&P 500.
Individual Stocks
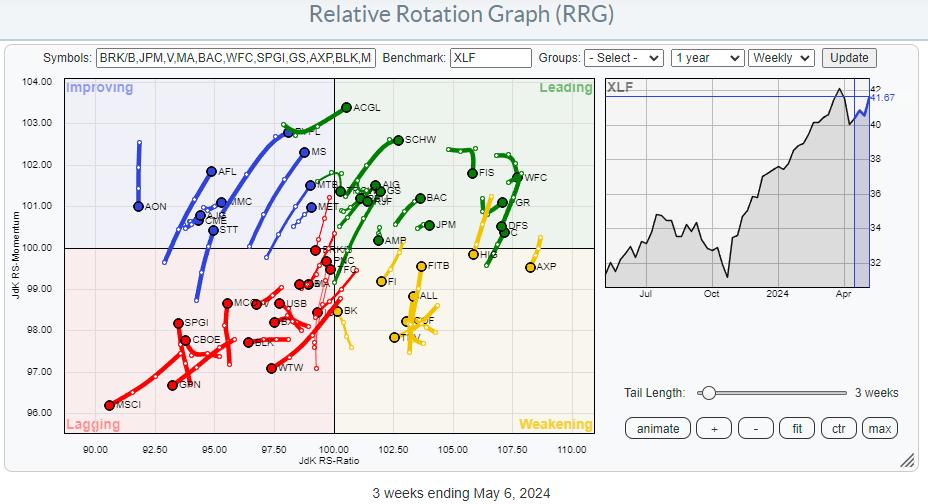
The RRG for individual stocks inside the financials sector shows an evenly-distributed universe around the (XLF) benchmark. Going over the tails for the individual stocks, I found a few names that are definitely worth a closer look.
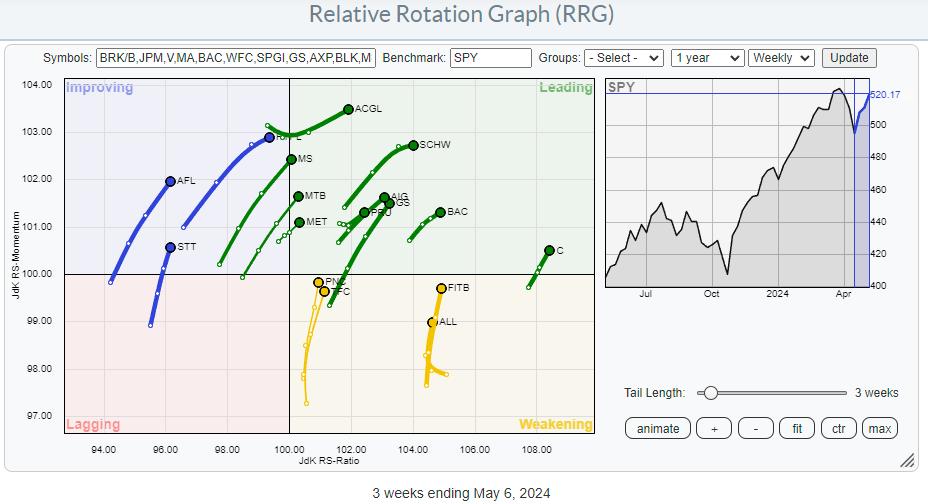
This RRG shows the tails at a strong heading, narrowing the search for good stocks. While checking out the individual charts, I found several promising names. The three that I want to mention here are not only at strong rotational trajectories, but also (close to) breaking out, AND they are some major names in the sector.
Morgan Stanley
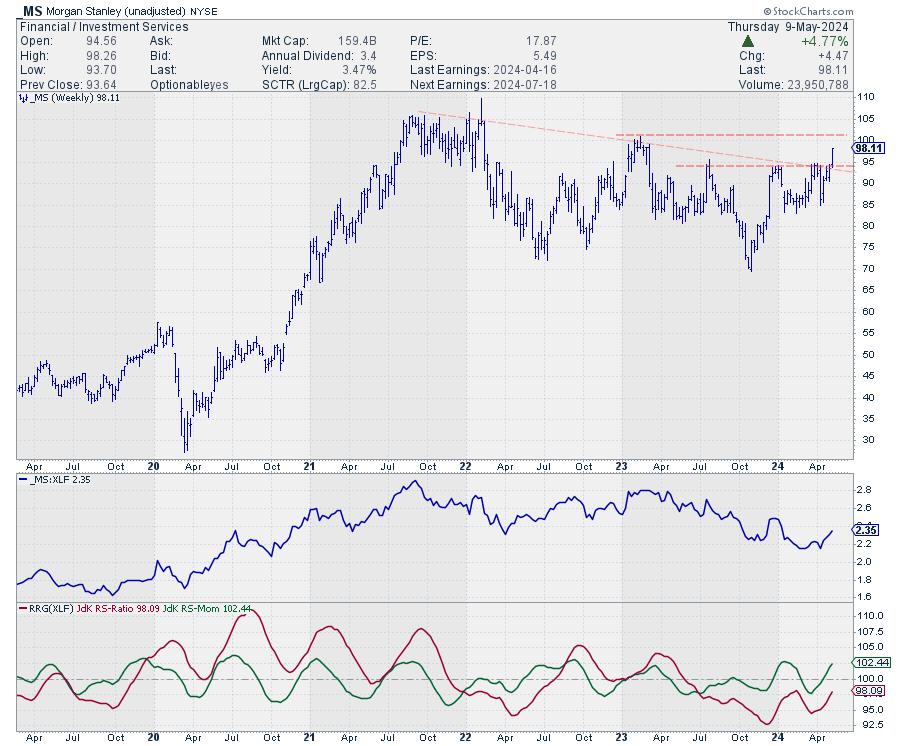
MS is breaking a double resistance level this week, as the horizontal barrier over the most recent peaks and the falling resistance line coming off the 2021 peaks coincided. This unlocks fresh upward potential for MS, with intermediate resistance waiting around 100 before nearing the area around the all-time high at 105.
Subsequently breaking these barriers will push this stock further into the leading quadrant, making it one of the leaders in the sector.
Citigroup
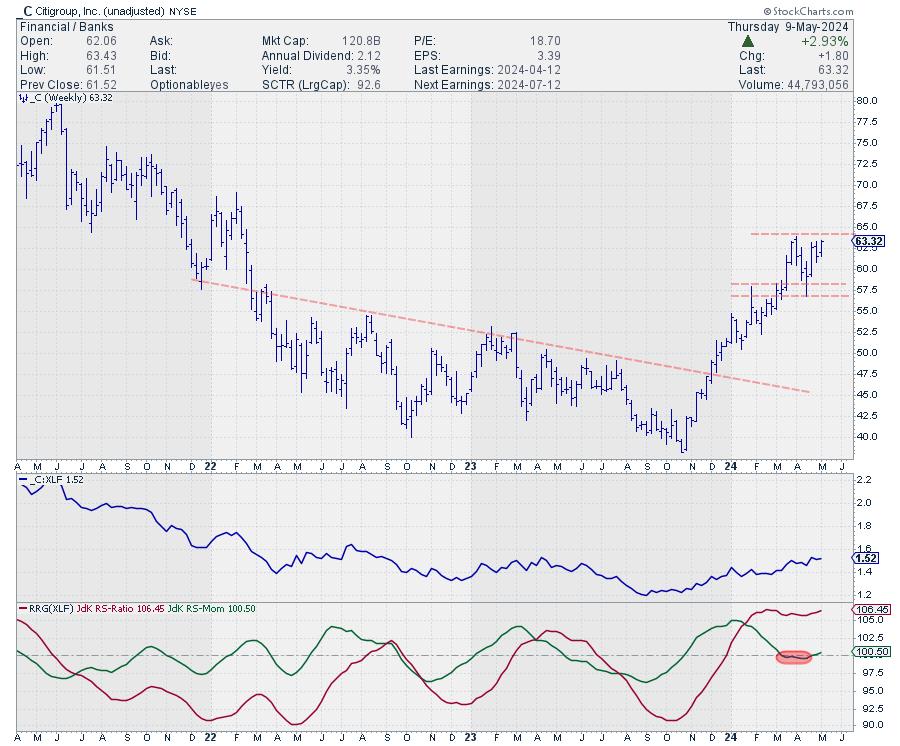
Citigroup is still trading below its previous high. However, given the recently-formed higher low and the strong rally out of it, an upward break is likely. Such a break is supported by the recent relative rotation back into leading from weakening.
Just like MS, C is also one of the bigger names in the financials sector. Strength in big names is usually what drives a sector up.
Bank of America
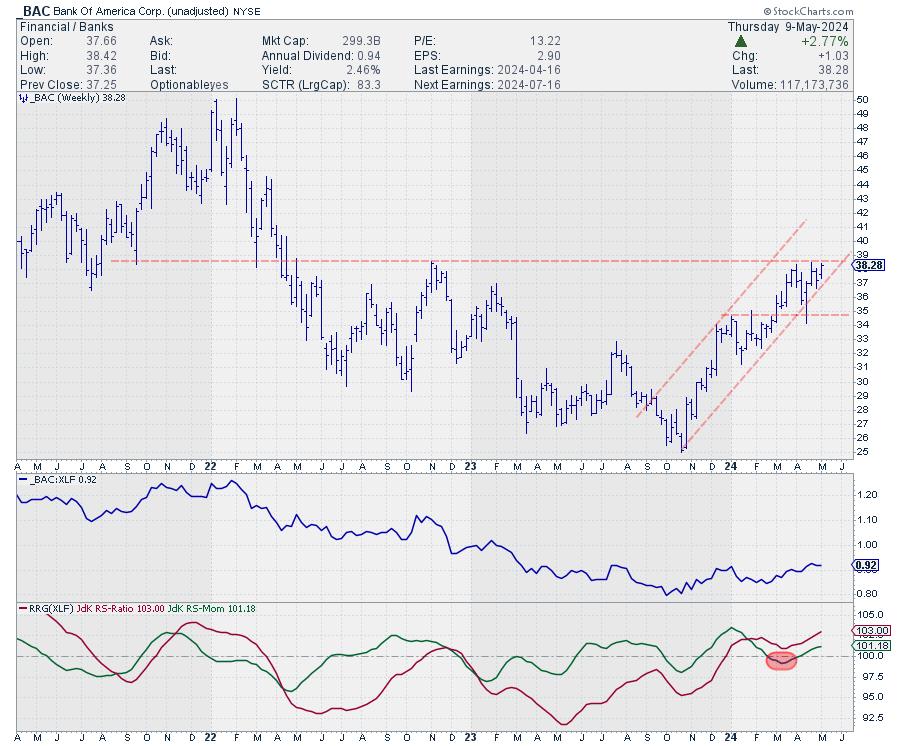
BAC is also close to breaking overhead resistance, after which there is plenty of upside. Relative strength is coming out of a long downtrend that started early in 2022, making this a major reversal. Taking out the barrier at 38 opens the way for a further move toward 50, which is substantial. But unlike you may think, that area is NOT the all-time high for BAC… that was set around 55 in October 2006.
Like MS and C, BAC is also one of the more important stocks in the Financials sector. Another important name in the sector is GS, which I did not include as it is already well underway after breaking higher.
When such important names in a sector are all starting to break higher, it is good news for that sector.
#StayAlert, –Julius
Julius de Kempenaer
Senior Technical Analyst, StockCharts.com
Creator, Relative Rotation Graphs
Founder, RRG Research
Host of: Sector Spotlight
Please find my handles for social media channels under the Bio below.
Feedback, comments or questions are welcome at Juliusdk@stockcharts.com. I cannot promise to respond to each and every message, but I will certainly read them and, where reasonably possible, use the feedback and comments or answer questions.
To discuss RRG with me on S.C.A.N., tag me using the handle Julius_RRG.
RRG, Relative Rotation Graphs, JdK RS-Ratio, and JdK RS-Momentum are registered trademarks of RRG Research.

Julius de Kempenaer is the creator of Relative Rotation Graphs™. This unique method to visualize relative strength within a universe of securities was first launched on Bloomberg professional services terminals in January of 2011 and was released on StockCharts.com in July of 2014.
After graduating from the Dutch Royal Military Academy, Julius served in the Dutch Air Force in multiple officer ranks. He retired from the military as a captain in 1990 to enter the financial industry as a portfolio manager for Equity & Law (now part of AXA Investment Managers).
Learn More


