Indian equities have been quite jittery over the past few weeks. Broadly speaking, the headline index NIFTY50 ($NIFTY) fluctuated between 50 and 200 DMA in February. These DMAs are placed at 17885 and 17302 respectively. Lately the index has been making strong attempts to hold the 200-DMA as support on a closing basis. Despite some intermittent breaches of this key level, it is crucial that NIFTY holds this support on a concluding basis.
Meanwhile, this Indian multinational engineering conglomerate, which provides sustainable solutions in the energy and environment sectors, is showing a strong technical setup and suggesting a likely upward correction in the price in the coming days.
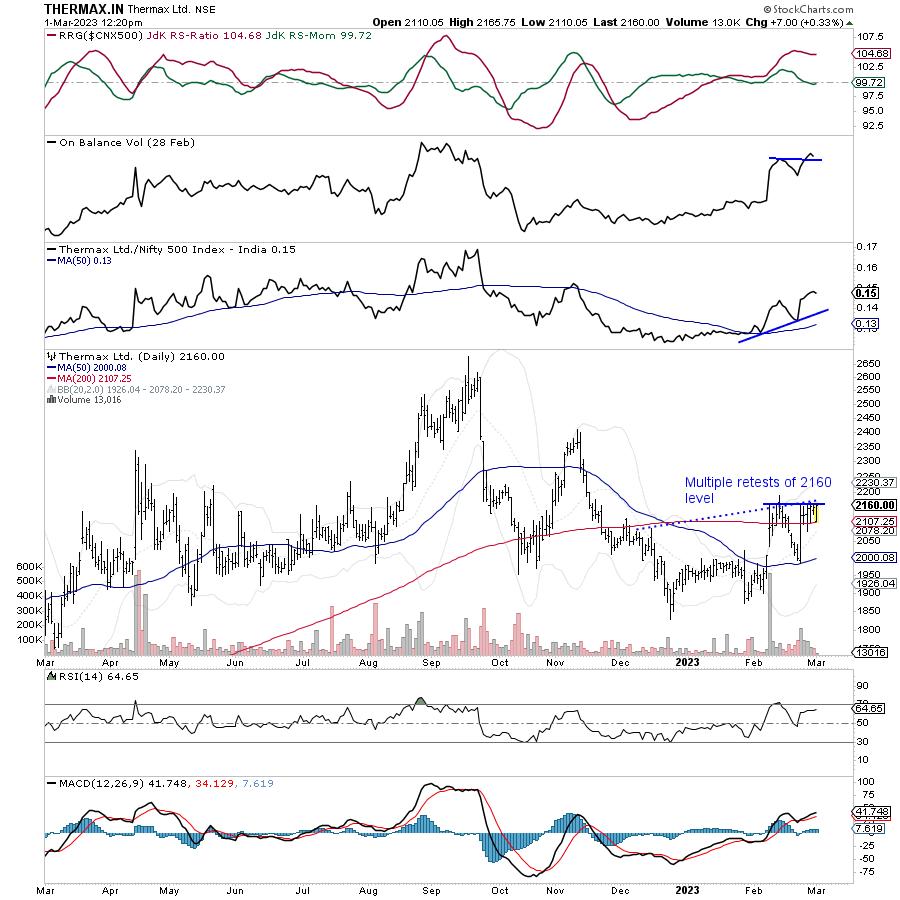
THERMAX.IN
From the lows that formed near 700 levels in the last quarter of 2020, THERMAX had a great run; In the ensuing rally, the stock rebounded over 286% from those levels. It peaked at 2607 in September last year. Recent price action shows that the stock may be on the verge of some resumption of bullishness again.
After the stock peaked just above the 2600 level in September, the stock experienced a corrective downtrend. On the ensuing retracement, the stock slipped below its 200-DMA. After struggling to keep its head above that point, the stock recovered somewhat. However, this recovery ended at 2400 where the stock made its bottom high. The stock has significantly underperformed the broader markets thereafter, staying under a corrective decline and making a strong attempt to base near the 1830 level.
Recent price action shows that the stock is trying to start a trend reversal after creating a potential bottom between the 1830 and 2000 levels. It also surpassed the 50-DMA and the 200-DMA; they are currently at 2000 and 2107 respectively.
The stock should consolidate just below the 2160 level; Any convincing move beyond this point is likely to result in significant price appreciation.
The RSI is neutral, showing no divergence on the price. The weekly RSI is breaking out of a formation and moving higher. The MACD is above the signal line and remains in continuous buy mode. The RS line versus the broader NIFTY500 index is moving higher on both the daily and weekly time frames; it has also passed its 50-period MA.
Importantly, while the stock is consolidating below the 2160 resistance point, the On-Balance Volume (OBV) has already surpassed its previous most immediate high. This confirms the involvement of volumes in the movement and also suggests accumulation in stock at current levels.
If the resolution of this technical setup occurs on the expected lines, the stock could test the 2350-2375 levels in the coming days. This would result in potential returns of ~9.50% from current levels. Any close below 2000 would destroy this technical setup and view.
And
Milan Vaishnav, CMT, MSTA | Consulting Technical Analyst | www.EquityResearch.asia | www.ChartWizard.ae
Disclosure in accordance with clause 19 of the SEBI (Research Analysts) Regulations 2014: The analyst, family members or his employees have no financial interest below 1% or above 1% and have not received any remuneration from the named companies.
The securities discussed and opinions expressed in this report may not be suitable for all investors who need to make their own investment decisions based on their own investment objectives, financial condition and the needs of certain recipients. This should not be construed as a substitute for the exercise of independent judgment by a recipient.
The recipient should independently assess the investment risks. The value and yield of investments may vary due to changes in interest rates, exchange rates or other reasons. Past performance is not necessarily a guide to future performance. Use of the research reports and other services is subject to the terms of use at https://equityresearch.asia/terms-of-use
The research analyst has not directed or co-directed the offerings of any reviewed company and has not received any such compensation for such activities from any reviewed company.
The Research Analyst has not received any compensation from its merchant banking activities.
The Research Analyst has adopted an independent approach with no conflicts from anyone. The research analyst has not received any remuneration or other benefits from the companies or third parties named in the report in connection with the preparation of the research report.
Research analyst compensation is not based on any specific merchant banking, investment banking or brokerage service transaction.
The research analyst is not involved in market making activities for the companies mentioned in the report.
The research analyst states that no material disciplinary action has been taken against him by any regulatory authority affecting equity research analysis activities.
This report is not intended or intended for distribution to, or use by, any person or entity who is a citizen or resident of any locality, state, country or other jurisdiction where such distribution, publication, availability or use would be contrary to law or would violate any regulations or subject the Research Analyst to any registration or licensing requirement within any such jurisdiction.

Milan Vaishnav, CMT, MSTA is a capital markets professional with nearly two decades of experience. His area of expertise includes consulting in portfolio/fund management and advisory services. Milan is the founder of ChartWizard FZE (UAE) and Gemstone Equity Research & Advisory Services. As a Consulting Technical Research Analyst and with over 15 years experience in the Indian capital markets, he has provided clients with top quality independent technical research focused on India. He is currently a daily contributor to ET Markets and The Economic Times of India. He is also the author of one of India’s most accurate Daily/Weekly Market Outlooks – a Daily/Weekly Newsletter currently in its 18th year of publication.


