My recent discussions on the Market Misbehavior podcast have often included some comments on the interest rate environment, particularly the shape of the yield curve. We’ve had an inverted yield curve since late 2022, and so the yield curve taking on a more normal shape could mean a huge tailwind to certain sectors and groups.
When the Yield Curve is No Longer Inverted
Here we’re showing the Ten Year Treasury Yield along with two ways to show the shape of the yield curve by comparing different durations. The first panel below the price compares the 3-month yield to the 10-year yield, and the bottom panel shows the 2-year yield versus the 10-year yield.
Back in 2022, both of these spreads went below the zero line, indicating that the yield curve was inverted because long-term yields were now lower than short-term yields. Due to the Fed raising short-term interest rates to try to bring inflation in check after the COVID pandemic, along with a general downtrend in bond prices, this inverted shape to the curve raised fears among investors for a recession.
With inflationary pressures fairly subsiding into late 2024, the Fed has now begun lowering short-term rates, which will most likely cause the yield curve to regain a normal shape. As we can see from the Dynamic Yield Curve tool on StockCharts, the yield curve moving back to a normal shape can often lead to lower stock prices in the short-term. However, two ETFs come to mind that should do better in this new market phase.
Regional Banks Get a Major Tailwind
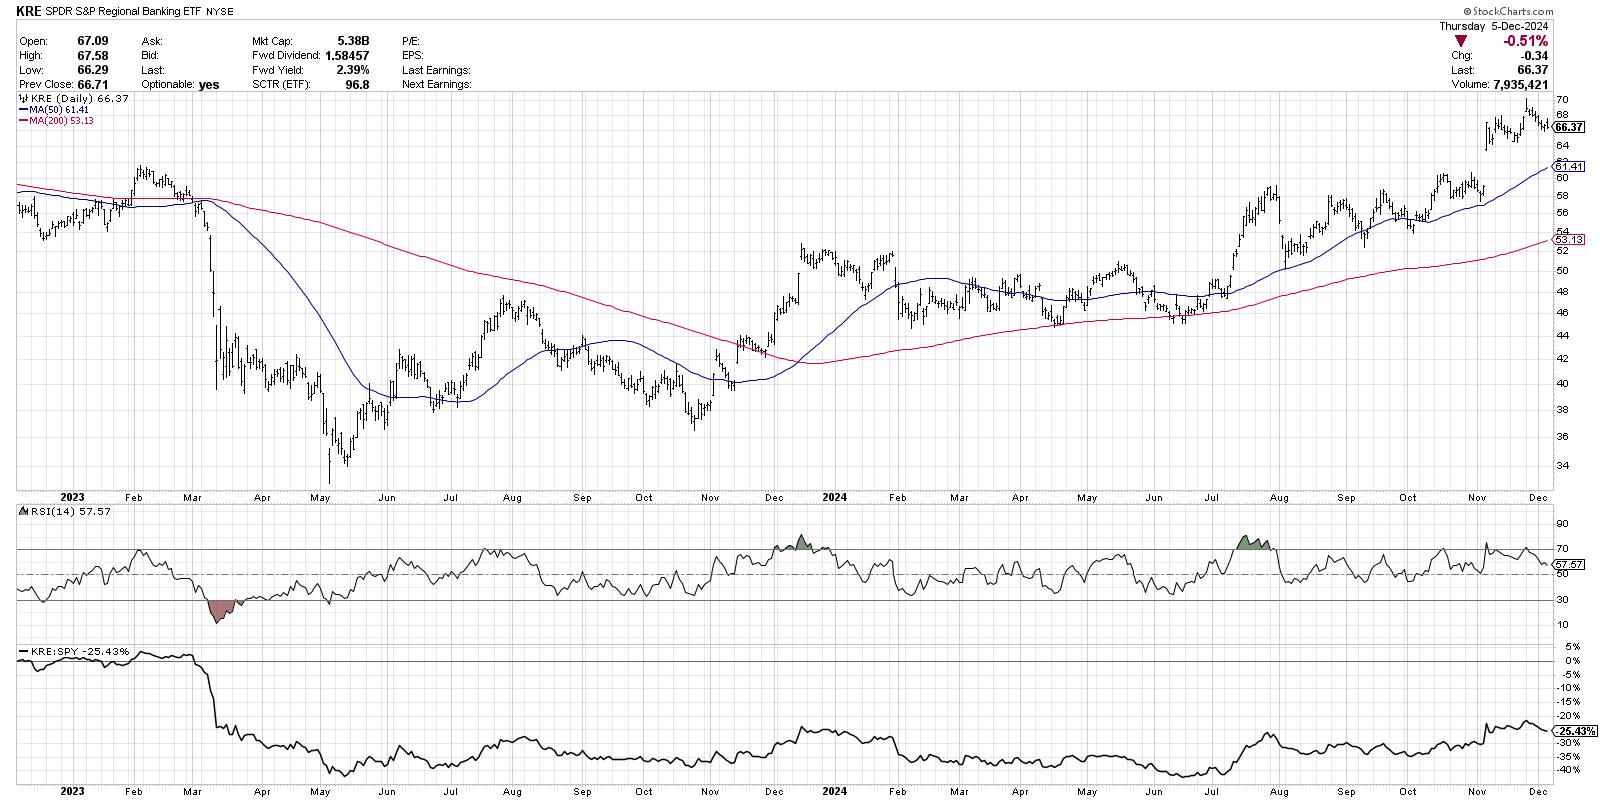
The financial sector in general experienced a particularly weak start to the year, with financials underperforming growth sectors into the summer. But regional banks have begun to mount a fairly strong rally in Q4, perhaps reflecting optimism going into 2025.

The SPDR S&P Regional Banking ETF (KRE) has shown a series of breakouts in 2024, including a new 52-week high in July on strong momentum, as well as a gap higher in early November. KRE now sits above two upward-sloping moving averages, and the RSI suggests strong but not excessive momentum.
Regional banks essentially borrow money at the short end of the curve, then lend those funds out to individuals at the long end of the curve to buy houses and make other large purchases. A steeper yield curve would imply a much more hospitable environment for regional banks, which could mean much further upside for KRE.
Small Caps Could Thrive Given Sector Weightings
While the S&P 500 and Nasdaq are both heavily weighted in growth sectors like technology and communication services, the small cap indexes feature much more of a balanced exposure to value and growth stocks. As guest Tom Bowley pointed out on our podcast, Smaller companies usually need to borrow money, so lower rates could mean a better environment for small caps as well.

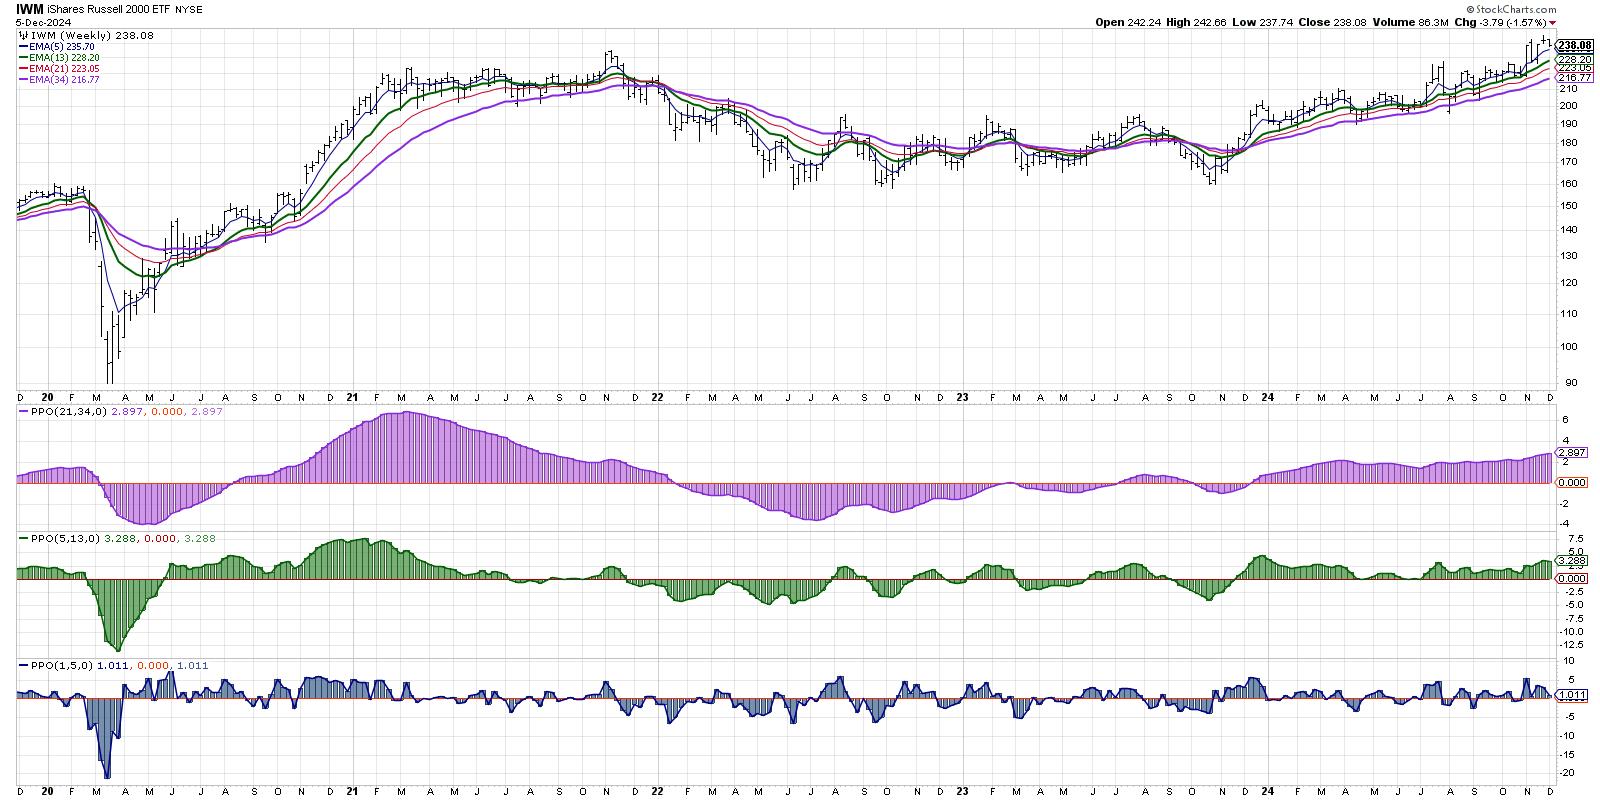
Here we’re applying our Market Trend Model to the iShares Russell 2000 ETF (IWM). Similar to our main Market Trend Model using the S&P 500, we can see that small caps have shown bullish signals on the long-term and medium-term models for all of 2024. While the short-term model has turned negative a number of times this year, the model currently indicates short-term strength.
The key with small caps is the relative strength, which measures whether the IWM is actually outperforming the S&P 500. While small caps have been moving higher in the second half of the year, they have still been underperforming large caps. However, given this shift in interest rates, we could be heading into a new year where small caps represent a decent opportunity to outperform the SPX.
RR#6,
Dave
PS- Ready to upgrade your investment process? Check out my free behavioral investing course!
David Keller, CMT
President and Chief Strategist
Sierra Alpha Research LLC
Disclaimer: This blog is for educational purposes only and should not be construed as financial advice. The ideas and strategies should never be used without first assessing your own personal and financial situation, or without consulting a financial professional.
The author does not have a position in mentioned securities at the time of publication. Any opinions expressed herein are solely those of the author and do not in any way represent the views or opinions of any other person or entity.

David Keller, CMT is President and Chief Strategist at Sierra Alpha Research LLC, where he helps active investors make better decisions using behavioral finance and technical analysis. Dave is a CNBC Contributor, and he recaps market activity and interviews leading experts on his “Market Misbehavior” YouTube channel. A former President of the CMT Association, Dave is also a member of the Technical Securities Analysts Association San Francisco and the International Federation of Technical Analysts. He was formerly a Managing Director of Research at Fidelity Investments, where he managed the renowned Fidelity Chart Room, and Chief Market Strategist at StockCharts, continuing the work of legendary technical analyst John Murphy.
Learn More


